Histogram
measures of spread
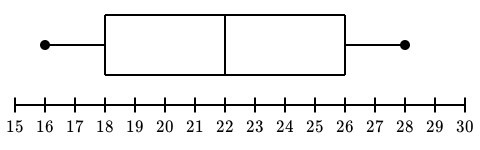
Box and Whiskers
vocab terms
measures of central tendency
100
Frequency density
what is the y axis
100
largest-smallest
what is range
100
Q3-Q1
what is the interquartile range
100
can be listed
what is discrete data
100
average
what is a mean
200
frequency over class width
what is frequency density
200
standard deviation square
what is variance
200
data more than 1.5 X IQR beyond the lower and upper quartiles
what are outliers
200
measured to any degree of accuracy and not possible to list all values
what is continuous data
200
the class containing the most data, when the classes are of equal width
what is the modal class
300
proportional to the frequency of each class
what are the areas of the columns
300
greek letter which acts as a symbol for standard deviation
what is sigma
300
it stretches out to the extreme values
what is the whisker
300
values far from the mean
what are extreme values
300
means the sum of all the x items
what is sigma x
400
9.5 ≤x<19.5 from 10-19
what is the class boundary
400
|x-x̅|>2 X standard deviation
what is an outlier
400
represents the middle 50 percent of the distribution
what is the box
400
frequency distribution that represents the sum of a class and all classes below it
what is a cumulative frequency graph
400
this distribution appears when 2 non adjacent values occur more frequently than the rest
what is a bimodal distribution
500

find the frequency density
0.2
1.4
2.1
1
2.4
500
for a set of 10 data items, Σ(x-9)= 7 and Σ(x-9)2 =17
find the standard deviation
1.1
500
 find the range
12
500
non numerical
what is categorical data
500
126 132 116 122 130 132 126 138 117 111
find the mode, mean and median
mode :126
mean :125
median :126