What is the mean of a set of data?
Line graph
what needs to stay consistent from real thing to model?
scale
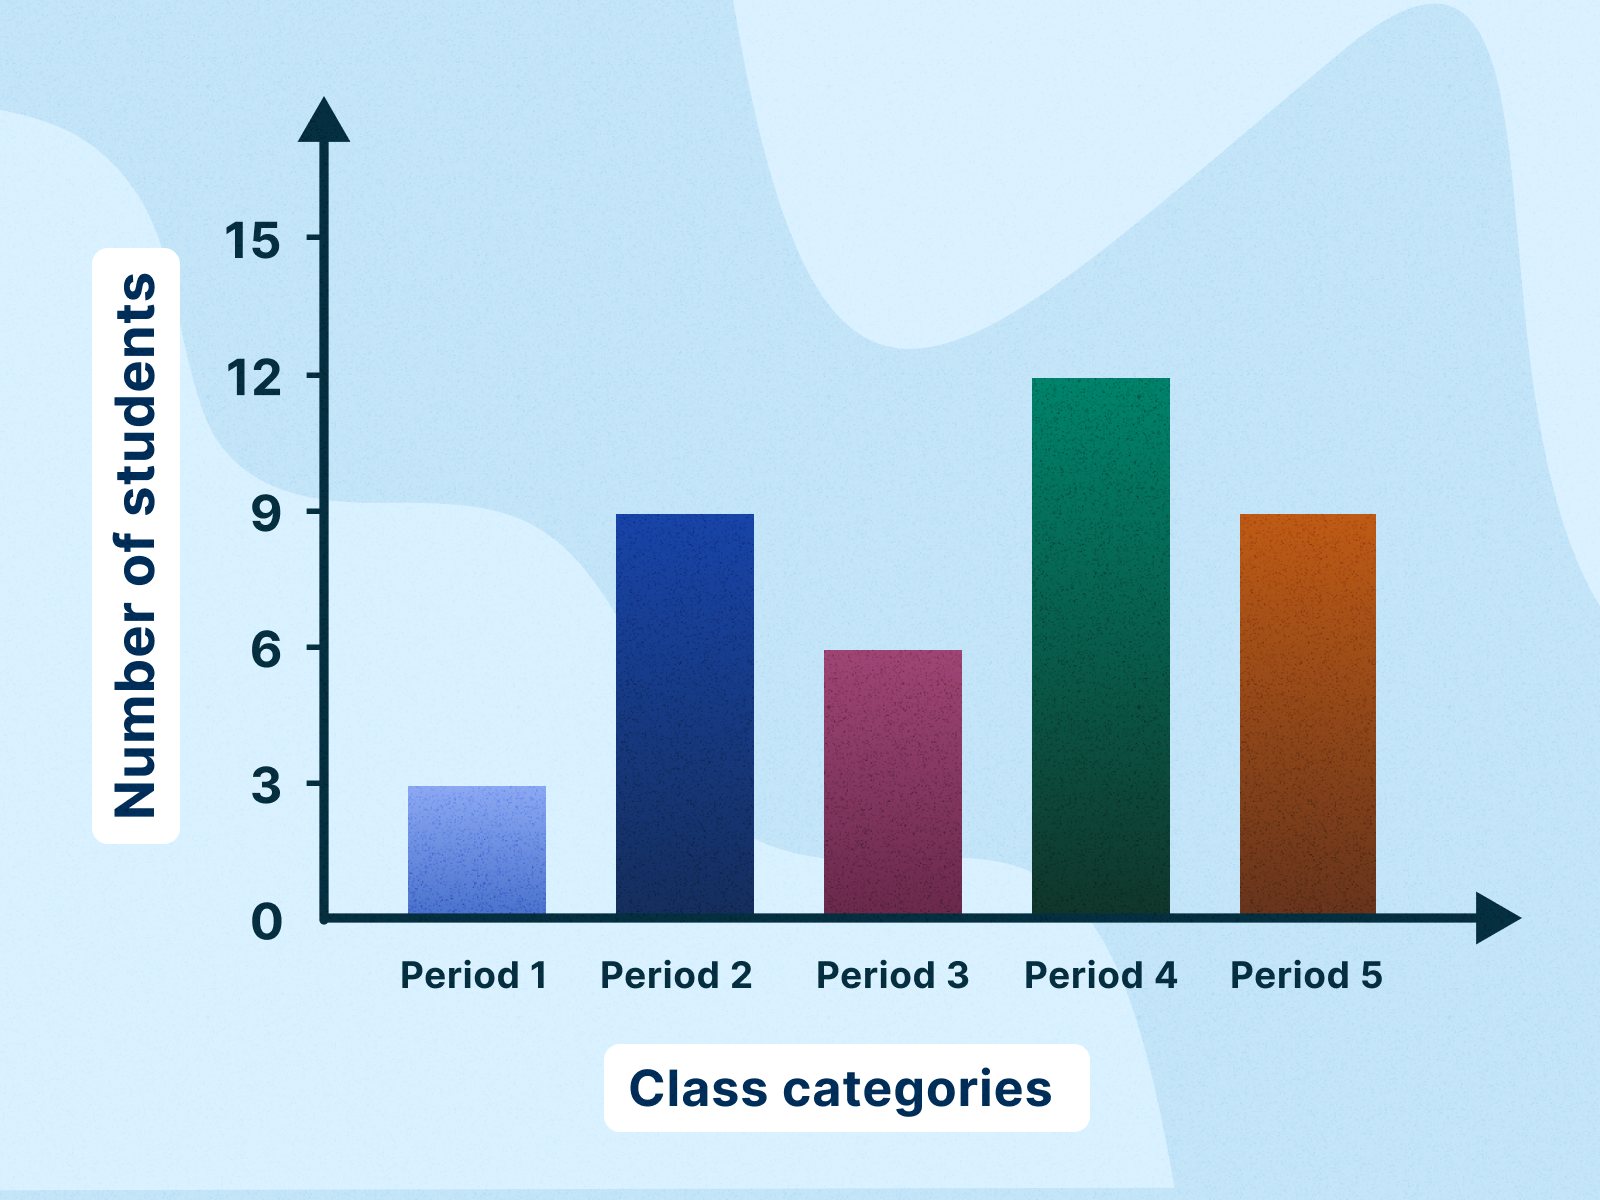
Tell me about this graph
period 4 has the most students
period 1 has the least students
What does a model do?
shows or represents the structure or function of the thing that is being studied
what type of graph shows multiple categories and the number of said categories?
bar graph
why are models used?
to show things that are too small to see or too complicated to understand normally
how many push ups did this person do on Wednesday?

5
how does a simulation differ from a model?
a simulation is the use of a model and is actually done rather than represented
what type of graph shows parts of a whole? hint: uses percentages
circle graph/pie chart
what are some downsides of models?
not always reliable to show all processes, not made of same materials, ect.
up to ms Vega's discretion
which flavor is the least popular and what percent of people liked it?
mint chocolate chip- 7%
