Vocabulary
Box Plots
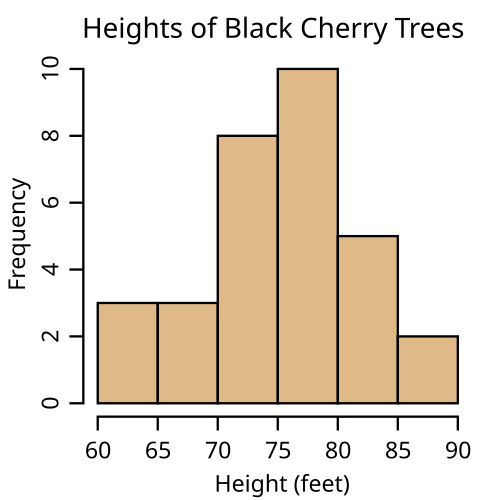
Histograms
Median & Mean
100
A sample collected in a way that certain members of the intended population have a lower or higher probability of selection than others
What is sample bias?
100

This class shows more variability.
What is Class A
100

Is this graph accurate or misleading?
Misleading
100
This is another word for mean.
what is average
200
An event is this word if it occurs without method, pattern, or purpose.
What is random?
200

One fourth of this class scored between 80 and 90.
What is class B?
200
 Is this graph accurate or misleading?
This graph is accurate
200
This is another word for median.
What is middle?
300
This is a sample that is drawn randomly.
What is a simple random sample?
300

All of the scores for this class were within the range of the other class.
What is Class B?
300
 The highest tree is this tall.
What is not shown on the graph?
300
Calculate the mean:
2, 4, 4, 6,
What is 4?
400
This is the entire collection of individuals or objects about which information is desired
What is a population?
400
 This class has a smaller median than the other class.
What is class A?
400

True or false: more than half of the trees are 75 ft or larger.
True
400
Calculate the median:
2, 4, 4, 6,
4
500
Numbers in a set of data that lie outside the pattern of the data are called this.
What is an outlier?
500
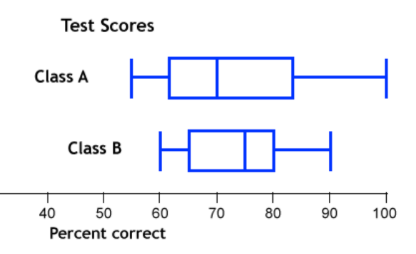 The median for Class A is this number.
What is 70?
500
This information is included in a box plot but NOT on a histogram.
What are the highest and lowest values?
500
Calculate the mean: 4, 36, 45, 50, 75
what is 42?