5 Themes
BOLTSS
Types of Maps
Map Projections
FUN RANDOM TRIVIA
100
The study of the physical features of the Earth and its atmosphere, and of human activity as it affects and is affected by these is
Geography
100
The "T" in BOLTSS stands for
Title
100
This kind of map shows the location of geographic areas and/or physical features
Reference Map
100
When considering distortions, a Mercator projection only maintains
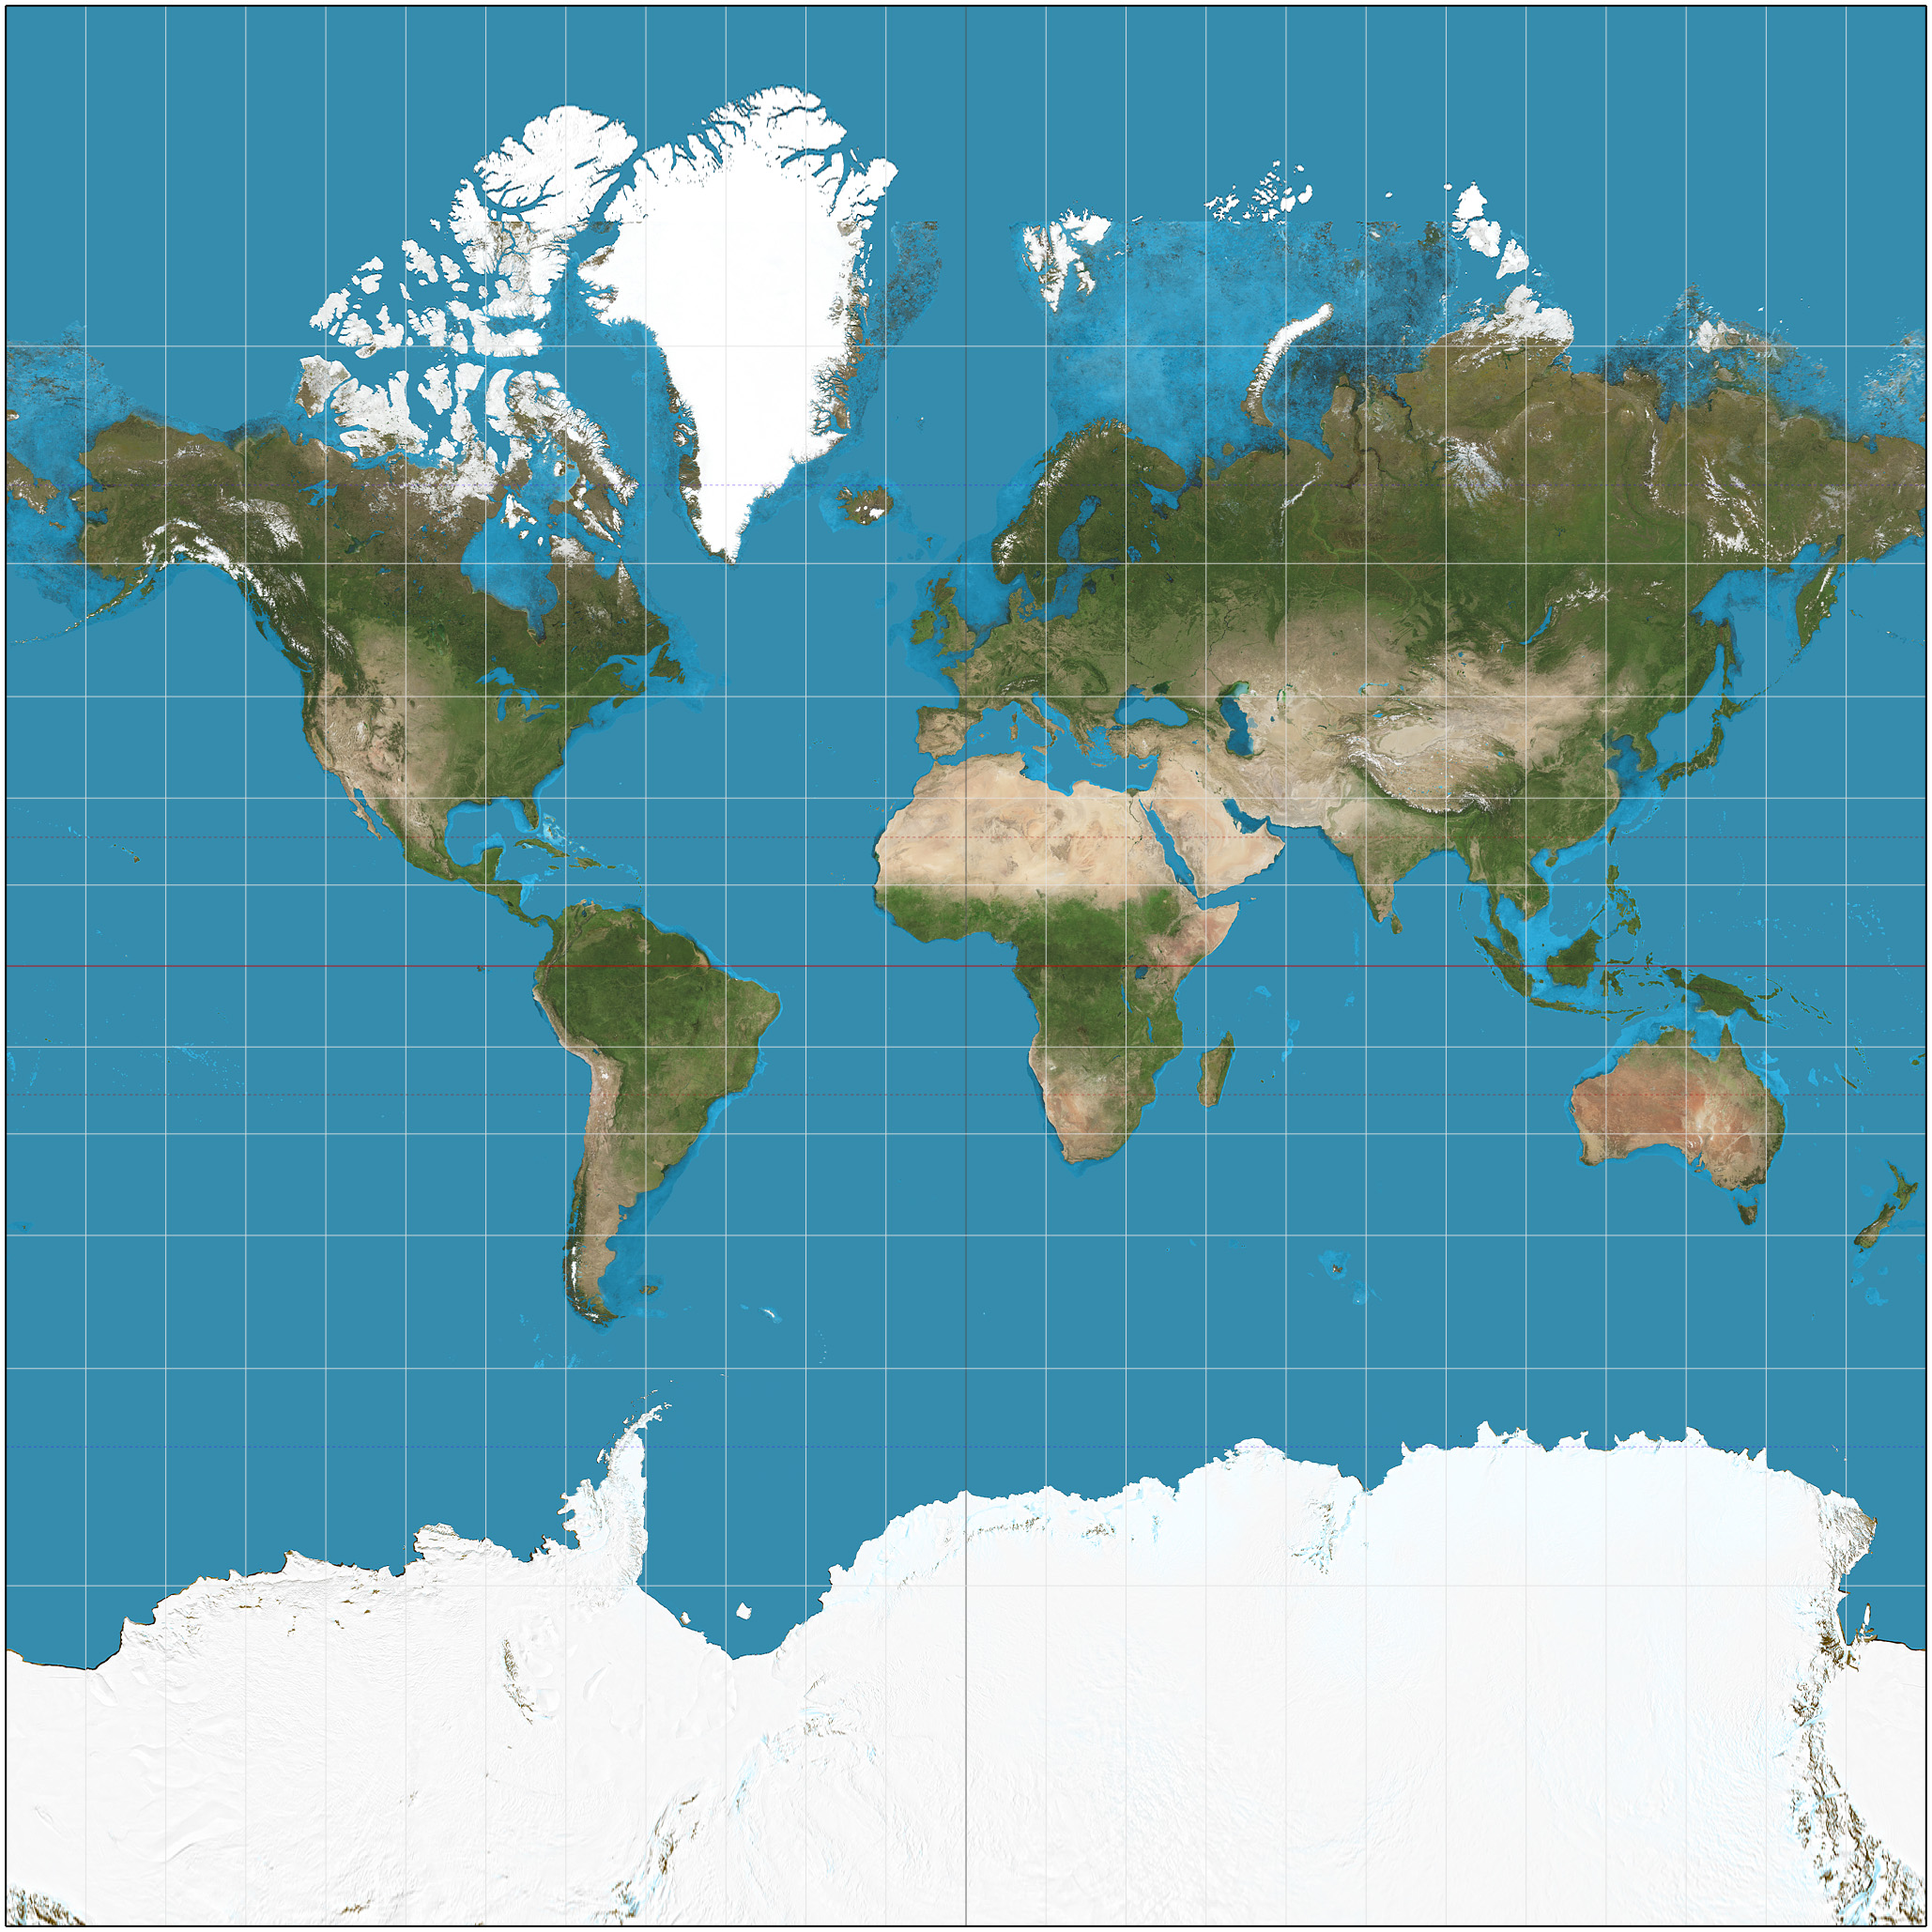
Direction
100
The tallest mountain in the world
Mt. Everest
200
Latitude measures the direction ________ and _________ of the equator
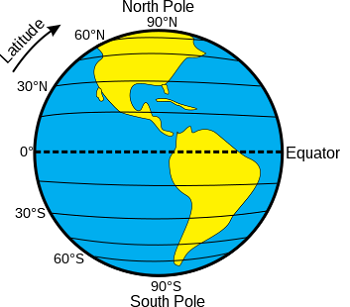
North and South
200
This term from BOLTSS tells the distance a unit of measure represents in an area shown on a map
Scale
200
Political Maps show the boundaries between governmental units. An example of a governmental unit is
Country, State, County
200
This kind of map projection is the most commonly used, because it acts as a compromise and does everything pretty well

Robinson
200
The world's longest river
The Nile River
300
The location of a place in relation to the location of another place
Relative Location
300
A map legend can also be called a map
Key
300
This kind of map indicates changes in elevation
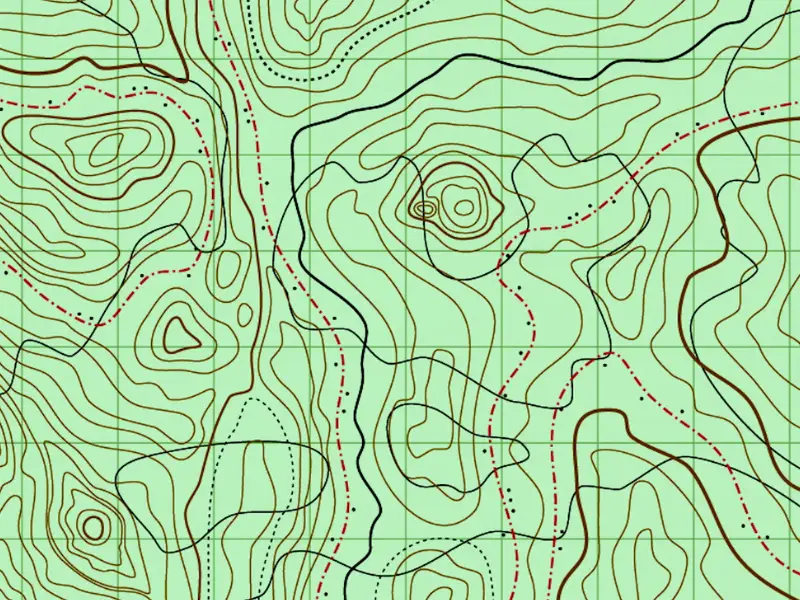
Topographic Map
300
This kind of map would be most helpful for pilots

Polar
300
This person wrote the famous play "Romeo and Juliet"
William Shakespeare
400
Push factors are qualities that make people want to __________ a place
Leave
400
What symbol is typically used as a way of figuring out how to orient the map?

Compass Rose
400
This kind of thematic map, often used in weather forecasting, uses lines to connect data points of equal value

Isoline
400
This kind of map accurately compares land sizes, but completely cuts out the oceans to do so
Goode-Homolosine
400
This famous artist painted the Mona Lisa
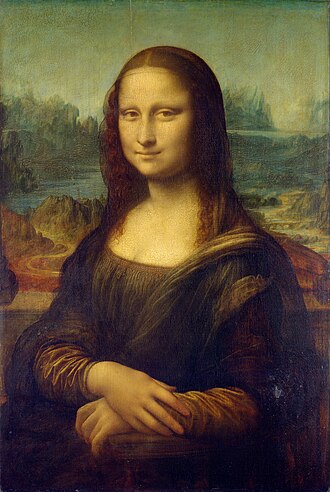
Leonardo da Vinci
500
Regions defined by people's feelings and attitudes about an area are called
Perceptual Regions
500
A _________ scale map shows more detail, but less area
Large Scale
500
Dot Density maps use dots to show the _______________ and density of a large number of related data
Distribution
(will also accept spread, pattern, location, etc)
500
If you wanted to navigate the ocean, the best map projection for you to use would be a
Mercator
500
The process of a caterpillar turning into a butterfly

Metamorphosis