Two Way Tables
Measures of Center
Measures of Variation
Dot Plots & Box-n-Whisker Plots
Miscellaneous
100
Each entry in a table is called what?
Joint frequency
100
Which of the following is NOT a measure of center: mean, median, mode, range?
RANGE
100
What is the range of the data set: 8,6,9,3,12,4,2?
10; Max - min; 12-2
100
Create a box-n-whisker plot of the following data: 12, 13, 15, 14, 12, 22, 24, 21, 28, 32, 35, 38
Show me the boards! :)
100
_______________ deals with collecting, organizing, and interpreting data.
Statistics
200
What are the marginal frequencies in this two-way table?
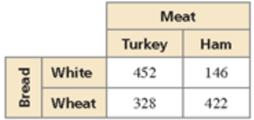
780, 568, 600, 750, 1350
200
What is the median of this set of numbers: 1, 3, 4, 6, 17, 18, 19, 19, 20, 21
17.5
200
What is the 5 number summary of the following data set: 6, 12,15,15, 12, 20, 13?
Min-6
Q1-12
Median (Q2)-13
Q3-15
Max-20
200
Create a dot plot for the number of pets each student has: 2, 3, 5, 1, 6, 7, 3, 2, 1, 2, 0. Identify any gaps, peaks, and clusters.
SHOW ME THE BOARDS! :)
200
The symbol for population standard deviation is...
lowercase Greek letter sigma, or σ
300
Complete the two way table.
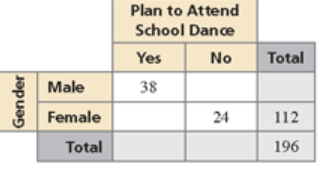
Ms Saunders will check your work.
300
What is the mode of these numbers: 1, 2, 3, 4, 5, 6, 17, 18, 29
No mode
300
What is the IQR if the 5 number summary is:
Min-7
Q1-9
Median (Q2)- 14
Q3-17
Max-23
8; Q3 - Q1 = 17-9
300
These three numbers divide the data set into four equal parts on a box plot.
What are quartiles(Q1: Lower quartile; Q2: Median; Q3: Upper quartile?
300
The ______________ _____________ of a box plot represents the middle 50% of data.
interquartile range
400
Interpret each marginal frequency. 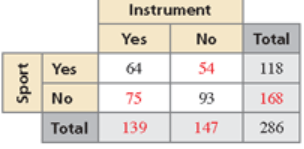
outlie
139 students play an instrument
147 students do not play an instrument
118 students play a sport
168 students do not play a sport
286 students were surveyed
rs
400
Find the mean, median and mode of these numbers:
21, 23, 24, 24, 25, 26
Mean:23.83
Median:24
Mode: 24
400
What is standard deviation?
The distance of a set of data points from the mean
or varies from the mean.
400
If a box-n-whisker plot has a min of 2, Q1 of 4, Median of 10, Q3 of 16 and max of 29, find the range and IQR
Range: 27, IQR:12
400
Given the data below what is the percentage of data above the median? (1,1,2,2,2,3,4,6,7,7,7,8,8,9,9,9)
50%
500
100 students at a school were asked whether they liked Physics, Chemistry or Biology best. 31 boys liked Physics best. 29 girls liked Biology best. 28 students liked Chemistry best. 3/5 of the students were boys. 19 boys liked Chemistry best. Create a two-way table to represent this data.
Ms Saunders will check your answer.
500
The number of telephones in a home: 3,3,2,4,3,7,6. Calculate the MEAN and explain how to find it.
4; all the numbers add up to 28...then divide by 7.
500
Which of the following is NOT a measure of variation: Range, IQR, MEAN, Standard Deviation
MEAN
500
Make a box-n-whisker plot for this data:
12, 13, 14, 15, 16, 16, 20, 25, 32, 35, 36
Show me the boards!
500
A teacher asked 20 students how many books they read last summer. The dot plot displays the data.
What is the MEAN number of books read?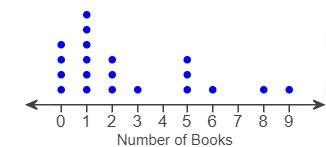
2.65/2.7