Dot Plots
Histograms
Vocab
Box Plots
Best Measure
100
How many students have 2 brothers and sisters?
5
100
What is the shape distribution of the graph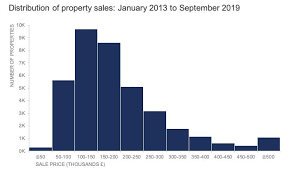
skewed right
100
How many times a value or interval is repeated is called its........
frequency
100
What is the range of the top graph?
12
100
What is the best measure of center from the box plot

median
200
What is the mode of the graph?
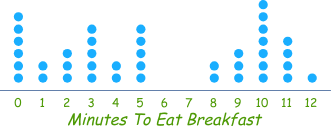
10
200
How many students took the math test?

30
200
Favorite color is what type of data?
Categorical/qualitative
200
According to the box plot, what is the upper quartile?
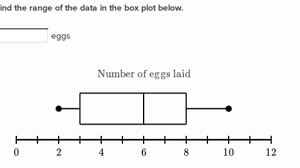
8
200
What is the mean of data set A. You will need to use Data set B #line. Round to the nearest tenth

3.1
300
What is the range of the data graph shown.

4
300
How many data points are between 21-50
:max_bytes(150000):strip_icc()/Histogram1-92513160f945482e95c1afc81cb5901e.png)
26
300
A group of many data points close together is called a......
cluster
300
What is the IQR of box plot #3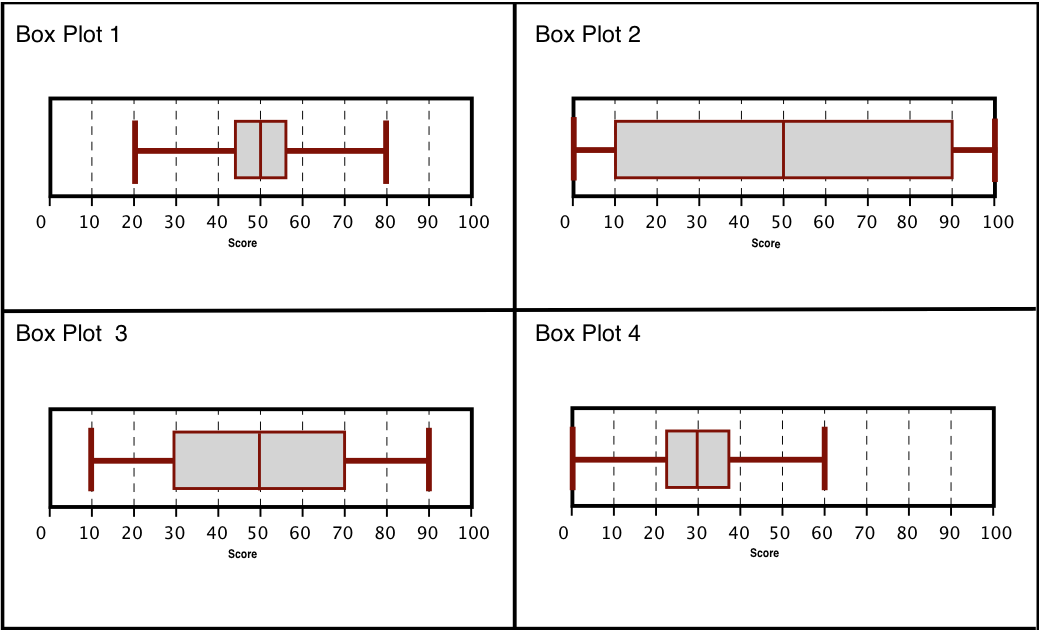
40
300
What is the best measure of spread?
Interquartile Range (IQR)
400
What is the median data point?
5
400
The median fall within which school year. You may use desmos.
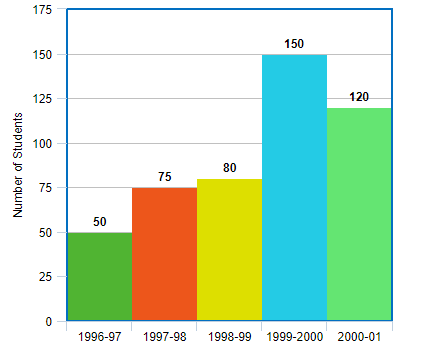
1999-2000
The 238th student held the median.
400
A distribution that is even on both sides of the graphs peak is called..............
symmetrical
400
What is the shape distribuiton of the box plot?
skewed left
400
What is the best measure of center?
median.