Line Graphs
Picture Graphs 1
Picture Graphs 2
Bar Graphs 1
Bar Graphs 2 & Other
100
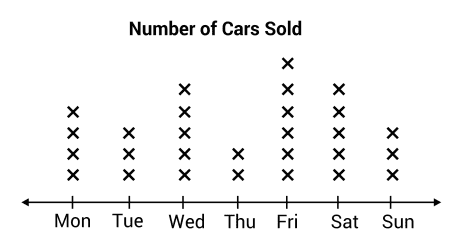
Which day were the most cars sold?
Friday
100
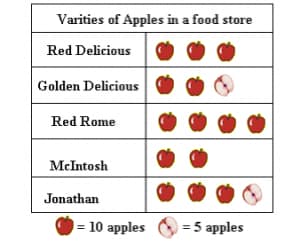
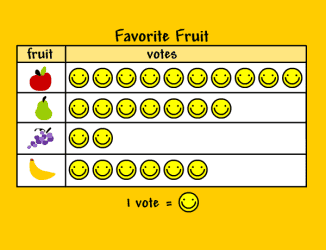
Look at the scale. What does 1 whole apple represent?
10 apples
100
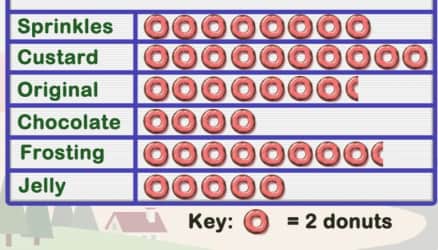
What type of donut is the most popular?
Bonus 100!
How many donuts does that type have?
Custard. 20 donuts.
100
What is the scale?
The scale is 2.
100
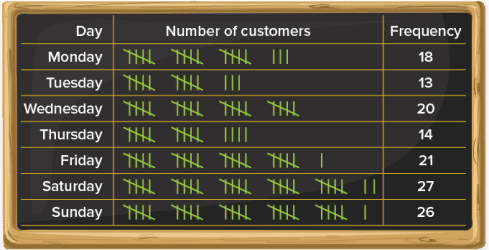
What kind of chart/table is this?
Frequency Table
200
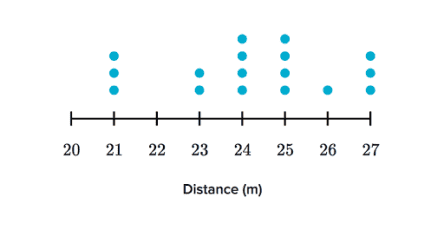
How many students ran 24 meters?
4 students
200
How many Jonathan apples are in the store?
35 Jonathan apples
200
How many people voted for original and chocolate donuts?
23 votes.
200
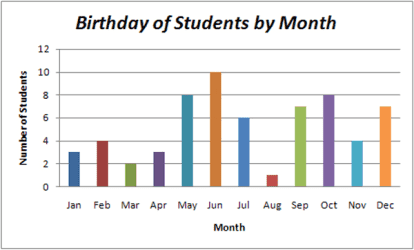
How many students were born in June?
10 students.
300
Which day of the week was the slowest for the dealership?
Thursday
300
How many total red delicious and golden delicious apples are in the store?
55 total apples
300
How many more frosting donuts are there than chocolate donuts?
9 donuts.
300
How many more students were born in June and May combined than in April?
15 students.
300
How many people like soccer?
400
How many students ran 25 meters or greater?
8 students
400
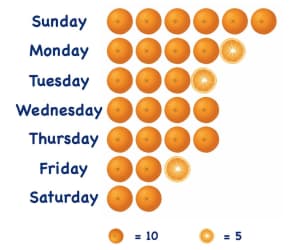
Were more oranges sold on Tuesday and Thursday or Monday and Friday?
Tuesday and Thusrday.
400
How many students voted in all?
25
400
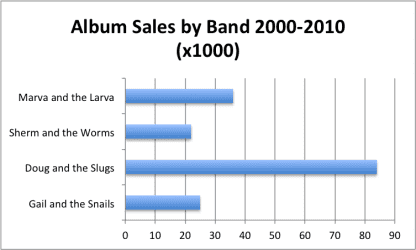
Which band sold the most albums? How many did they sell?
Doug and the Slugs. 85 albums.
400
How many fewer people like softball than basketball?
2 people.
500
How many cars were sold on Friday and Saturday combined?
11 Cars
500
Which two sports combined equal the same amount as soccer?
Basketball and Other.