Interpreting Line of Best Fit
Predicting from line of Best Fit
Solving & Interpreting Linear Models
Scatter Plots & Association
Linear vs. Nonlinear Relationships
100
A researcher studied the relationship between the number of times a certain species of cricket will chirp in one minute and the temperature outside. Her data is expressed in the scatter plot and line of best fit below. What is the meaning of the y-value on the line when x=120?
Based on the question, would the answer be precise or an estimate?
Estimate
100
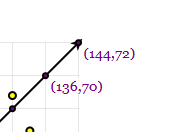
 From Point (25, 14) to point (30, 23), what is the change in x and the change in y?
Change in x is 5
Change in y is 9
100
In the equation y = mx + b, what does m represent?
Slope
100
What type of graph shows the relationship between two quantitative variables?
Scatter plot
100
If the points in a scatter plot can be approximated by a straight line, the relationship is _____.
Linear
200

What is the x-axis &the y-axis represent in the context of this scatter plot?
X = Femur Length
Y = Height (centimeters)
200

What would the change in x & y be from point (8,8) to point (12,11)?
Change in x would be 4
Change in y would be 3
200
In the equation y = mx + b, what does b represent?
Y-intercept
200
As one variable increases, the other variable also increases. This is called what type of association?
Positive association
200
If the points form a curve instead of a straight line, the relationship is _____.
Nonlinear
300
 For the point (37, 149.7), what would the 37 and 147.7 be described as in context to the scatter plot?
37 centimeters in Length
149.7 centimeters in Height
300
 Based on the graph above, what would the x value be when y is 74?
x=152
300
True or False: A line of best fit must pass through every data point.
False
300
As one variable increases, the other variable decreases.
Negative association
300
FREE PASS
FREE PASS
400
Eli decides to research the relationship between the length in inches and the weight of a certain species of catfish. He measures the length and weight of a number of specimens he catches then throws back into the water. After plotting all his data, he draws a line of best fit. What does the point (45,71.4) represent?
Based on the questions, would the answer be precise or an estimate?
Precise
400
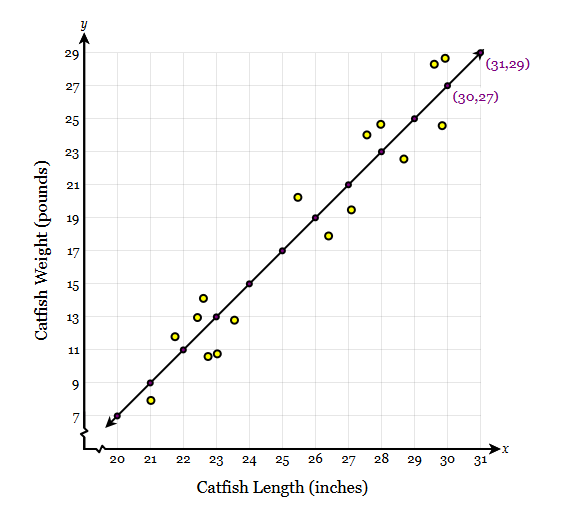
Based on the line of best fit, how much would you predict a catfish with a length of 33 inches would weigh?
33 pounds
400
What does the y-intercept represent in context?
The starting value / value when x = 0
400
What do we call a point that does not follow the overall pattern of a scatter plot?
Outlier
400
What kind of relationship is shown when data points curve upward as x increases?
Nonlinear association
500
Landon keeps track of the number of people inside a music hall to attend a concert by looking at the number of scanned tickets. He plotted the data on the graph below, where x=0represents the time at 6 p.m., then drew a line of best fit. What does the point (2,171) on the line of best fit represent?
Based on the question, would the answer be precise or estimate?
Estimate
500
 Based on the line of best fit, for what y-value does x=24?
y=20
500
What does the slope represent in a real-world situation?
The rate of change / how much y changes for each 1 unit of x
500
What does it mean if a scatter plot shows no clear pattern?
No association
500
Why might a linear model NOT be a good fit for some data?
Because the data follows a curved or nonlinear pattern