Vocabulary
Association
Predictions
Identify
y=mx+b
100
The term used for a data point that does not fit in with the rest of the data.
Outlier
100
Determine the association shown in the scatter plot below.

Positive Association
100
Predict how high the balloon will be after 2 minutes.

435 feet
Acceptable Range: 432-438 feet
100
Which color trend line is the best fit for the scatter plot?
Red
100
What is the y-intercept of the trend line? b = ??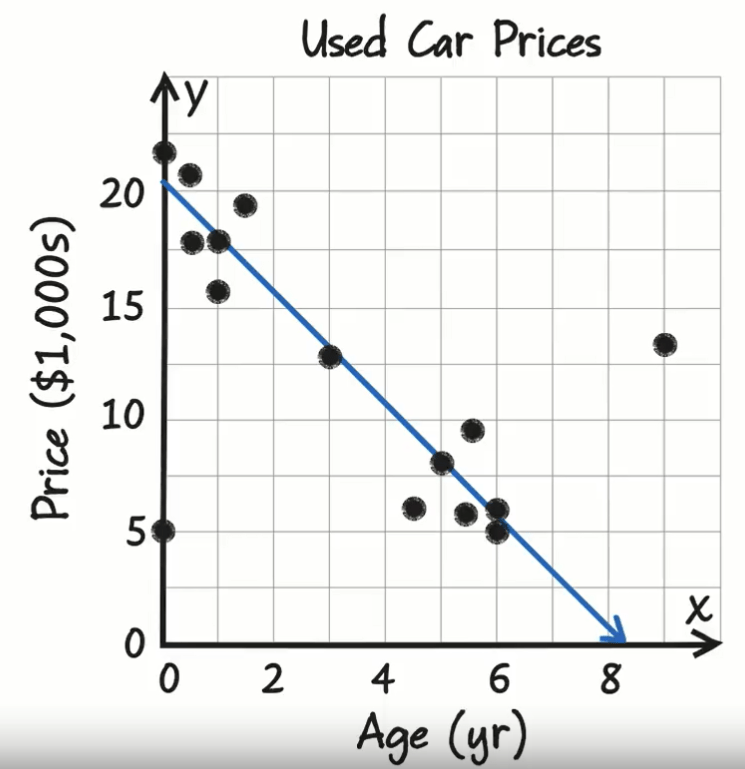
b = 20
200
_______ ______ are graphs that use points to show data between two variables, or bivariate data.
Scatter Plots
200
Determine the association in the scatter plot below.

No Association
200
What test score would a student get if they studied 2.5 hours?

78
Accepted: 76-79
200
Which trend line is the best model of the data?
1 2 3


1
200
What is the y-intercept of this trend line? b = ?
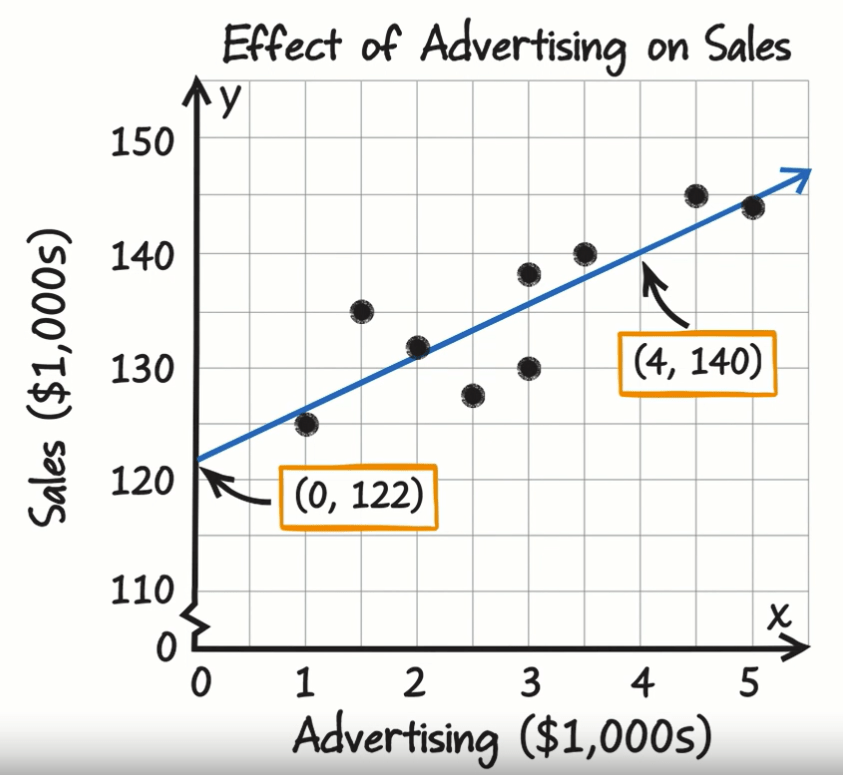
b = 122
300
The term for a line on a scatter plot, that is drawn near the points that is used to make a prediction between the data sets?
Line of Fit
300
Describe the association seen in this scatter plot.
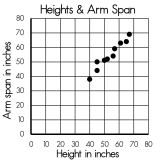
positive association
300
What is the predicted Volume of the tank after 1 minute?

32 Gallons
Acceptable Answers: 30-40 Gallons
300
List at least 2 details of a good line of fit.
1. straight line
2. half of the points on each side of the line
3. line is through the middle of the points
300
What is the slope of the trend line? m = ?

m = 18/4 = 9/2 = 4.5
400
What are the types of associations seen in a scatter plot.
Positive, Negative, and No Association
400
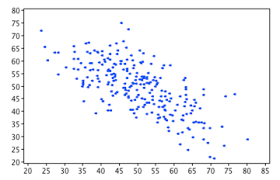
What is the association seen in this scatter plot?
Negative Association
400
How much time has passed if the temperature of the freezer is 20 degrees?
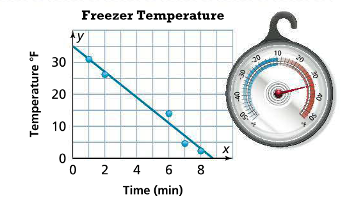
3.7 Minutes
Accepted: 3.5-3.9 Minutes
400
Which point is the outlier?
Point B
400
What is the equation for the trend line? y = mx + b

y = 4.5x + 122
500
If the points generally follow a straight line, then we would call that relationship?
Linear
500
Describe the association seen in this scatter plot.
negative association
500
Predict how much time has passed if the altitude of the ballon is 360 feet.

10 Minutes
Accepted: 9.7-9.9 Minutes
500
How many calories did the person who spent 35 minutes exercising burn?
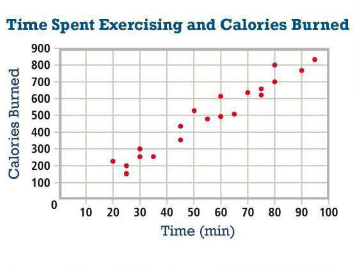
250 Calories
Acceptable: 240-260 Calories
500
Using the scatter plot and the points, write an equation for the trend line.
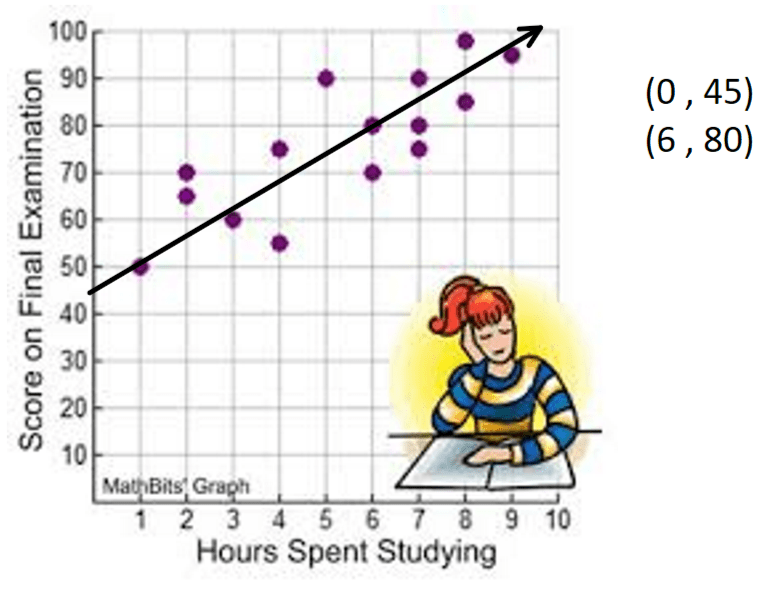
y = 5.8x + 45