Variables
Creating and Reading Scatterplots
Correlation
Correlation Coefficient and Residuals
Lines of Best Fit
100
This variable goes on the x-axis.
What is the independent variable?
100
This is how you know you draw a line of best fit by hand.
What is there should be an equal number of points above and below the line?
100
What type of correlation does this graph show?

What is positive?
100
This is the correlation coefficient.
What is approximately -0.3?
100
The linear regression equation for a data set is y = 21.2x + 23.5, where y represents the number of balloons sold by a party store each week and x represents the week number. This is the number of balloons the store will expect to sell during week 8.
What is 191 balloons?
200
This variable is impacted by the other variable and is placed on the y-axis.
What is the dependent variable?
200
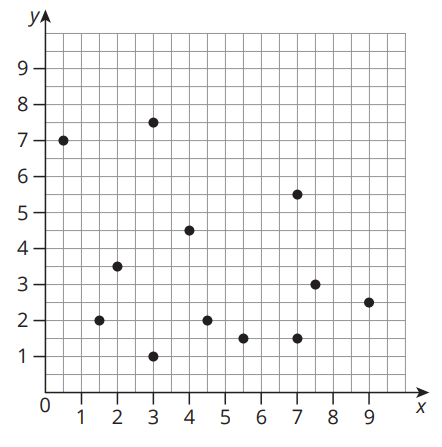
Which point is the outlier?
What is approximately (375, 13)?
200
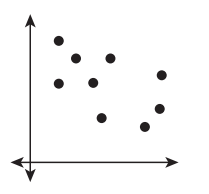
What type of correlation is shown in the scatter plot?
:max_bytes(150000):strip_icc()/dotdash_Final_Inverse_Correlation_Dec_2020-01-c2d7558887344f5596e19a81f5323eae.jpg)
What is negative?
200
This is the correlation coefficient.
What is approximately -0.5?
200
The linear regression equation for a data set is y = − 2.8x + 70.8, where y is the temperature in degrees Fahrenheit and x is the number of hours since 8 a.m. The slope represents this.
What is a decrease of 2.8 degrees Fahrenheit for each hour that goes by?
300
If I am graphing the number of shots made and the hours of practice for a player, which would be the independent variable?
What is the number of hours of practice?
300
Based on the scatter plot, this it the price for a 0.25 carat ring.

What is about 650?
300
This is the impact of television size on the amount of time someone spends watching tv.
What is no correlation? TV size has no impact on the amount of time you watch tv.
300
The table shows Adam’s age and shoe size. This is the correlation coefficient.
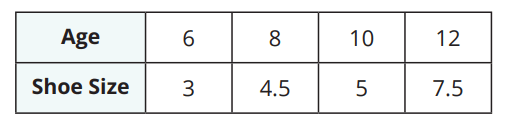
What is approximately 0.9?
300
The scatter plot represents the estimated mosquito population within a certain radius of a city park starting in the year 2010. The linear regression that best represents the data is y = 680x + 11,722. This is a reasonable estimate for the number of mosquitos in 2025.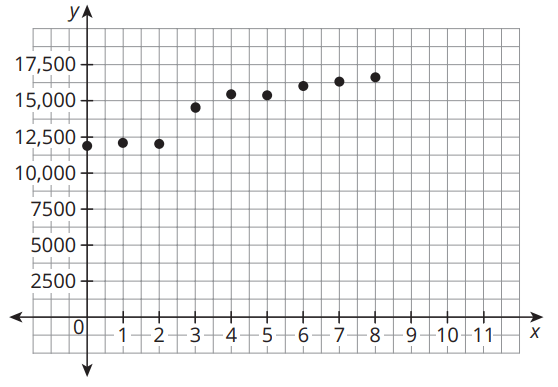
What is unable to calculate since the value falls outside of the given set?
400
On a graph showing the relationship between salary and years of experience which variable would be the dependent variable?
What is salary?
400
If a person is 45 years old, based on the scatter plot, what should they expect their income to be?
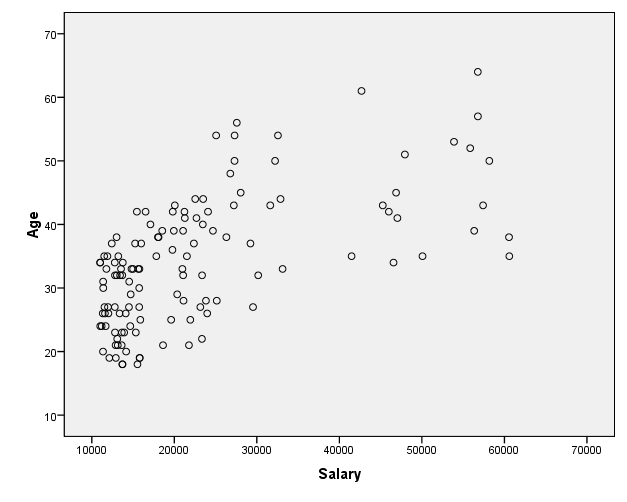
What is about 45,000.
400
This occurs when one variable increases as the other variable increases.
What is positive correlation.
400
The residual plot tells us this about the scatter plot.

What is that the data is not linear?
400
The table shows Savannah’s salary for different years.
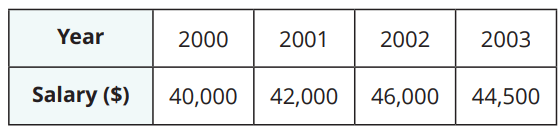
This is a reasonable estimate for the line of best fit.
What is y = 40000 + 2000x
500
Write a sentence describing the relationship between the average daily temperature and the number of beach visitors.

The number of beach visitors increases as the average daily temperature increases.
500
This is the name of the line that describes the trend in a scatterplot.
What is a line of best fit or trend line?
500
This occurs when there appears to be no trend in the data.
What is no correlation?
500
The linear regression equation for a data set is y = 1.6x − 4.1. The actual value at x = 3 is 0.9. This is the residual value at x = 3.
What is 0.2?
y = 1.6(3) - 4.1 = 0.7
0.9 - 0.7 = 0.2
500
This is the date of the Integrated I final exam.
What is Wednesday, June 11?