Variables
Outliers and Predictions
Correlations
Reading & Creating Scatterplots
Line of Best Fit
100
This variable goes on the x-axis.
What is the independent variable?
100
What is an outlier?
What is a point that is distant (skewed) from the rest of the data?
100
What type of correlation does this graph show?
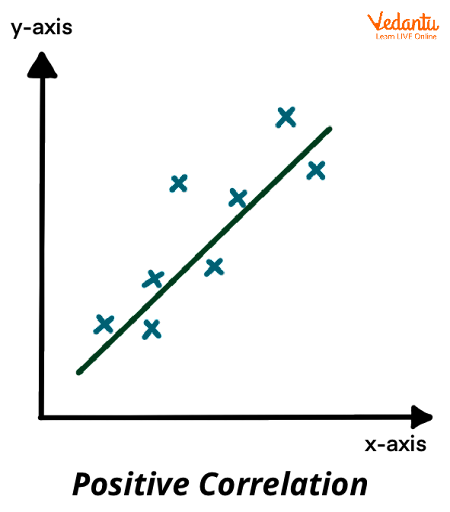
What is positive?
100
What are two points on the line of best fit?
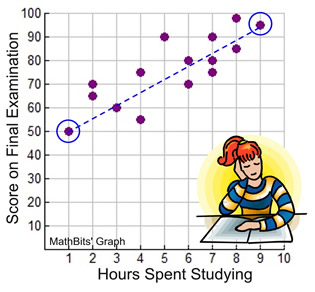
What is (1, 50) and (9, 95)
100
How do you determine where to place the line of best fit?
There should be an equal number of points above and below the line.
200
This variable is impacted by the other variable and is placed on the y-axis.
What is the dependent variable?
200
Which point is the outlier?
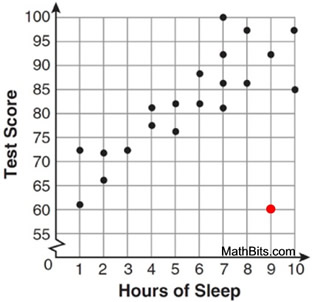
What is approximately (9, 60)?
200
What type of correlation is shown in the scatter plot?
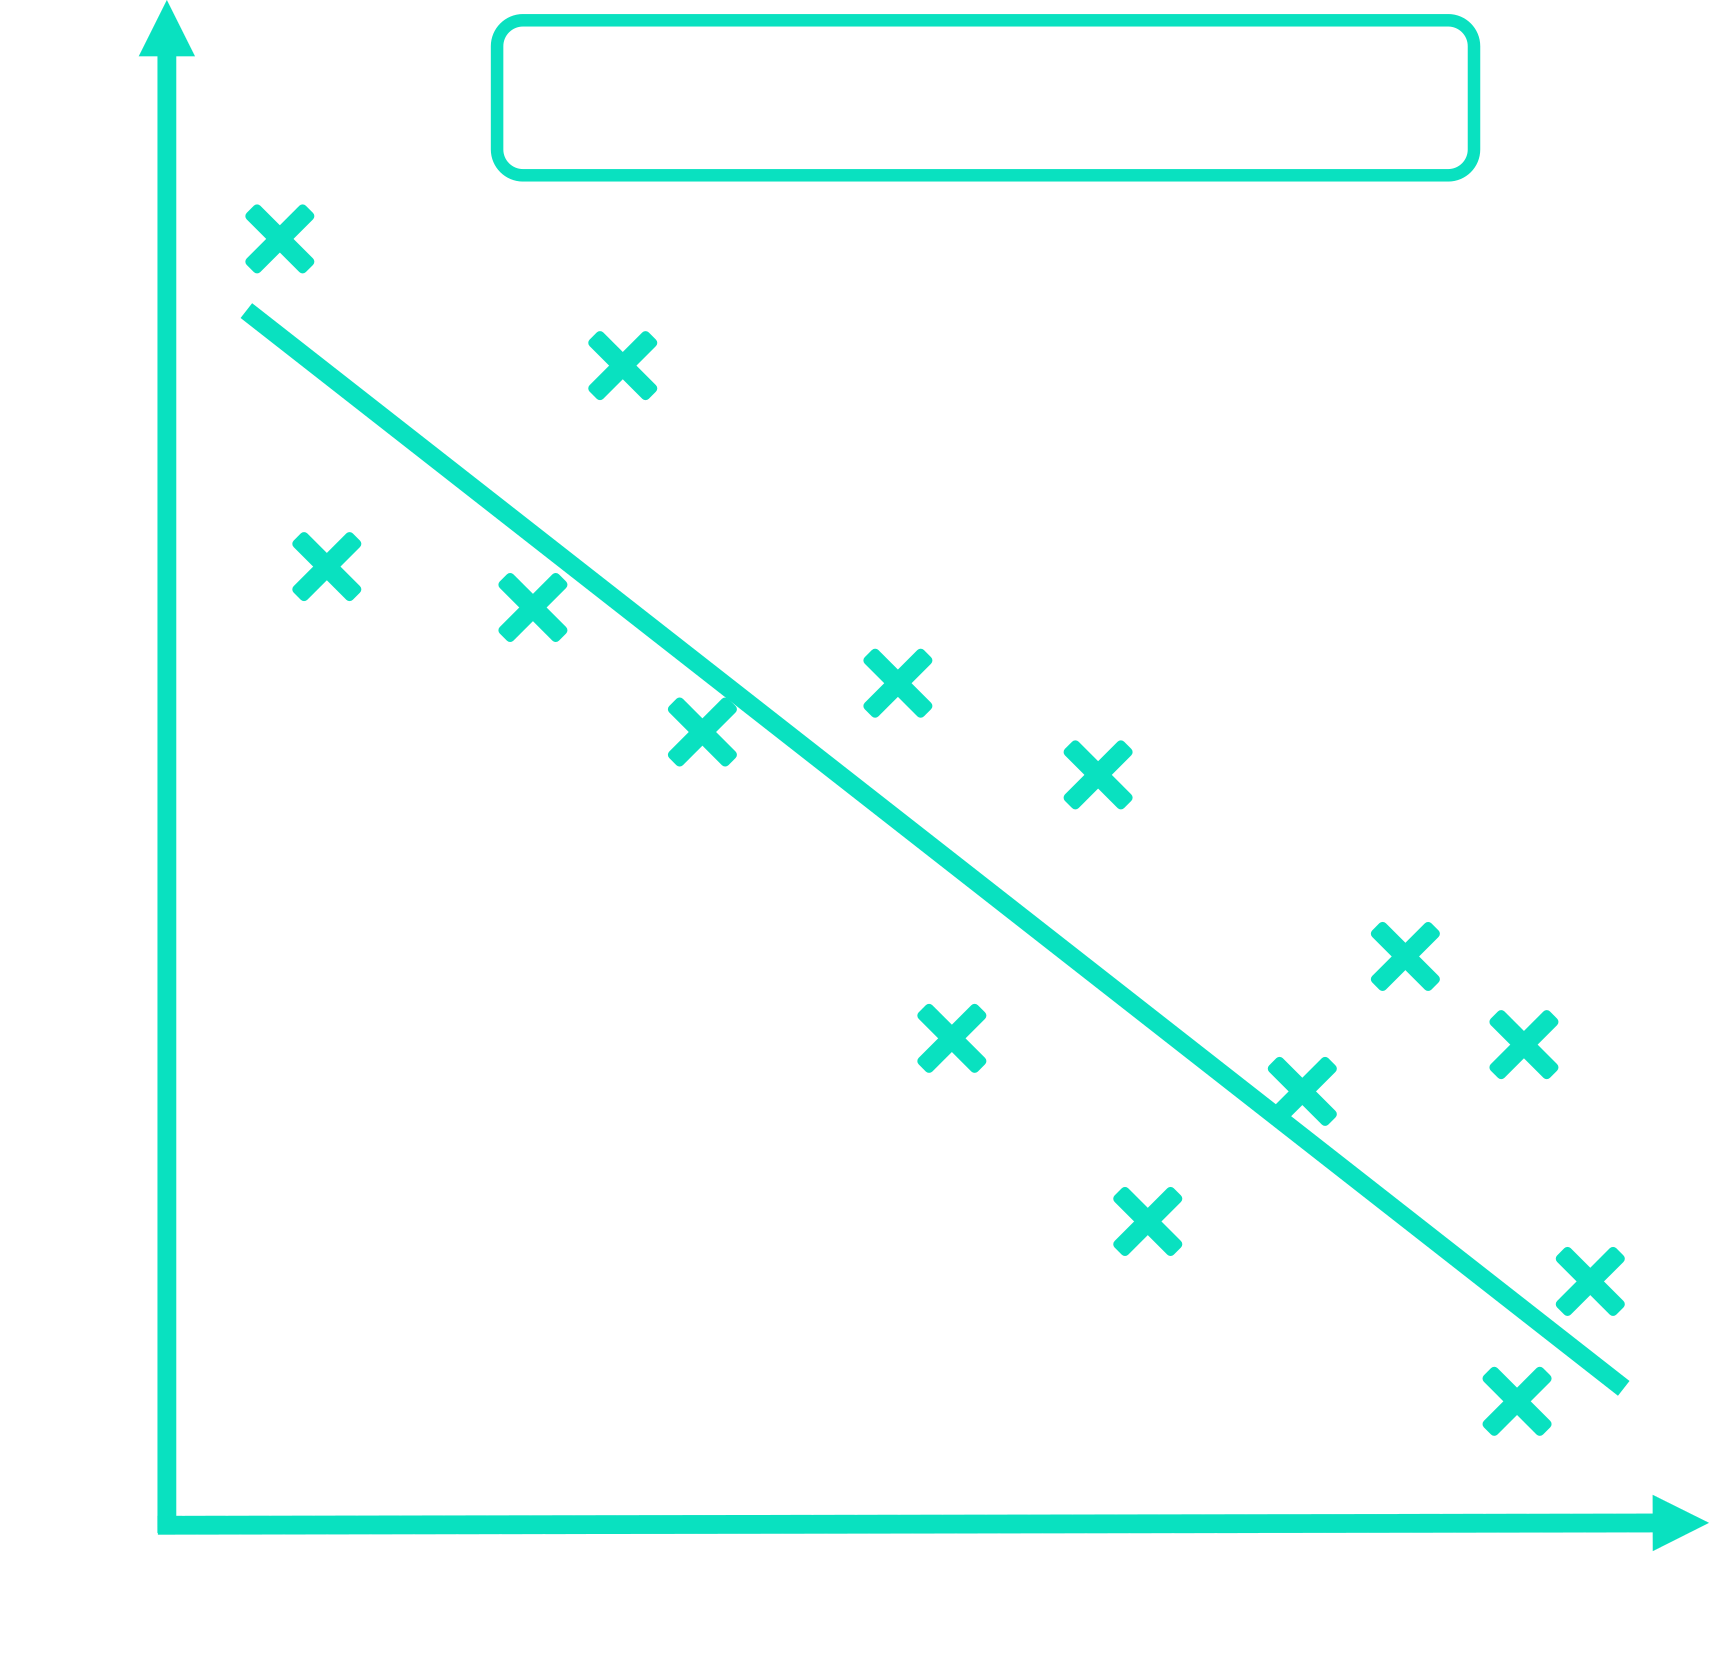
What is negative?
200
What is the association of this graph? Will the slope be positive or negative?
This graph shows a negative association and a negative slope.
200
Two points on the line of best fit are (4, 85) and (2, 70). Find the slope for the line of best fit using these points.
15/2
300
If I am graphing the number of shots made and the hours of practice for a player, which would be the independent variable?
What is the number of hours of practice?
300
Based on the scatter plot how many hours would be candle that weighs 15 oz last?

What is about 100 hours?
300
What type of correlation is shown? Write a sentence describing the impact or lack of impact that impulsiveness has on empathy.

What is no correlation? Impulsiveness has no impact on empathy.
300
How do you make predictions using a scatter plot?
1) Draw a line of best fit. 2) Determine the slope and y-intercept. 3) Write an equation and use it to make a prediction.
300
What are two points on the line of best fit?
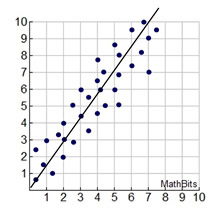
Two points on the line of best fit are: (2, 3) and (7, 10)
400
On a graph showing the relationship between salary and years of experience which variable would be the dependent variable?
What is salary?
400
If a person studies for 5 hours, based on the scatter plot, what should they expect their score to be?
What is about 70.
400
Describe what a positive correlation means for data.
When one variable increases the other variable will also increase.
400
Describe the association of this data (is it linear or non linear)
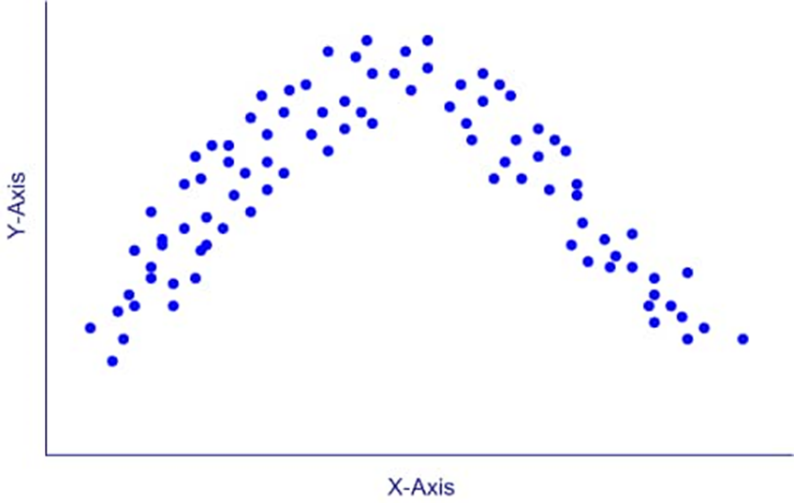
There is no linear association.
400
Find the slope between (5, 1) and (-2, 9)
m = -8/7
500
Write a sentence describing the relationship between the average daily temperature and the number of beach visitors.

The number of beach visitors increases as the average daily temperature increases.
500
What can you use to find a prediction of a data set?
Graph and the equation
500
Give an example where the mean absolute deviation is zero.
What is a set of data containing all the same number?
5, 5, 5, 5, 5, 5, or 6, 6, 6, 6, or 7, 7, 7, 7
500
Describe the association of this data (linear or non linear).

There is a linear association.
500
Write the equation of the line that has a slope of -3 (m = -3) and goes through the point (5, 2)
y = -3x +17