Correlations (Situation)
Outliers and Predictions
Correlations (graphs)
Reading & Creating Scatterplots
Line of Best Fit
100
What type of correlation is described below:
Hours of exercise and weight loss.
positive
100
What is an outlier?
What is a point that is distant from the rest of the data?
100
What type of correlation does this graph show?

positive
100
What two points could you use to best determine the line of best fit?

What is (16,300) and (22,500)
100
What is the line of best fit?
straight line that represents the data on a scatter plot the best way
200
What type of correlation is described below:
Temperature outside and amount of sno-cones sold
positive
200
Which point is the outlier?

What is approximately (30, 6000)?
200
What type of correlation is shown in the scatter plot?

negative
200
Estimate the y-intercept of this graph
(remember that the y-intercept is where the line crosses the y-axis)

5 or 5.5
200
What are two pretty points on the line of best fit?
Two points on the line of best fit are: (4, 1) and (3, 2)
300
What type of correlation is described below:
Temperature outside and number of pets
no
300
Based on the scatter plot how many CDs would be sold for 2 jars of jam?

What is about 15 CDs?
300
What type of correlation is shown?

no correlation
300
What components of a scatter plot help you make predictions?
Use the line of best fit
Use the equation for the line of best fit.
300
Josie and some of her friends rode motorcycles all day on Saturday. The table below shows the number of gallons of gas remaining at the end of each hour. Describe the relationship between Time(x-axis) and Gas(y-axis)

negative
400
What type of correlation is described below:
Time spent doing homework and number of missing assignments.
negative
400
If a person is 45 years old, based on the scatter plot, what should they expect their income to be?

What is about 45,000.
400
Create a scatter plot that has a strong positive correlation.
Chart with Points trending upward in a linear direction
400
Describe the correlation in this scatter plot.

Weak Linear Positive Correlation
400
Teresa records the ages and weights of 12 children in her neighborhood. If she records the data in a scatter plot, what type of relationship will she most likely see?
positive
500
What type of correlation is described below:
Number of visitors to a water park and temperature.
positive
500
The equation for the following line of best fit is y=-4x+80. Using your equation, determine the resting heart rate of someone who exercises 4.5 hours each week.

62 beats per minute
500
Create a scatter plot that has a negative weak correlation.
Chart with points decreasing and although in a linear fashion, it is not tight
500
What does the point (30,195) mean on this graph in the story?

30 pizzas sold earns $195.
500
As the age of a car increases, its value decreases. Which scatterplot best represents this relationship?
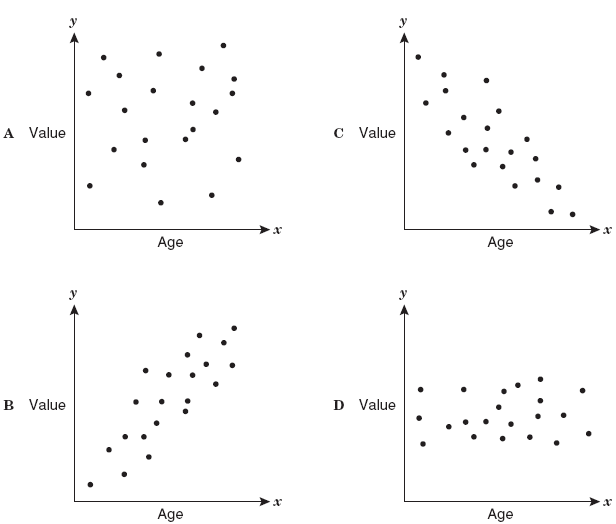
c