Correlations (Situation)
Correlations (graphs)
Relative Frequency
Line of Best Fit
Random
100
Hours after sunrise and temperature (from 6am to noon).
positive
100
What type of correlation does this graph show?
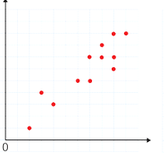
What is positive?
100
How do you find the relative frequency?
You make a ratio of frequency of something happening over the total.
100
How do you determine where to place the line of best fit?
There should be an equal number of points above and below the line.
100
Smallest ocean in the world.
Arctic
200
The number of siblings a student has and their mile time.
no correlation
200
What type of correlation is shown in the scatter plot?
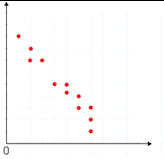
What is negative?
200
What ratio could be used to find the relative frequency of 8th Grade students?
(Need 2-way table)
218/681
200
Two points on the line of best fit are (4, 85) and (2, 70).
Find the slope for the line of best fit using these points.
15/2
200
The smallest prime number
2
300
Temperature outside and number of pets
no correlation
300
What type of correlation is shown?
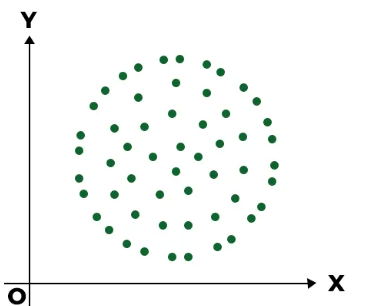
What is no correlation?
300
Of the 6th grade students, find the relative frequency of those who ordered pizza to the nearest percent?
(Need 2-way table)
49%
300
What two points cross the line of best fit?
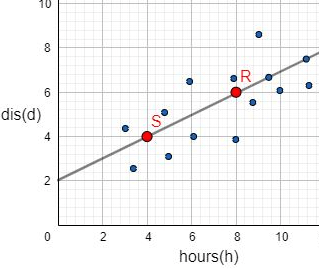
Two points on the line of best fit are: (4, 4) and (8, 6)
300
How many degrees in a circle?
360
400
The number of miles a car is driven and the amount of gas left in the tank (no refueling)
negative
400
Create a scatter plot that has a strong positive correlation.
Answers may vary.
400
What is the slope- intercept form equation?
y=mx+b
400
This bird is the national bird of USA.
Bald Eagle
500
Number of visitors to a water park and temperature.
positive
500
Create a scatter plot that has a negative weak correlation.
Answers may vary.
500
True or false and explain.
I can use any two points of a given set of data to determine the line of best fit for the data.
False, the points MUST be on the line of best fit.
500
This Kansas City Chiefs tight end is dating Taylor Swift.
Travis Kelce