Association
Predicting
Correlation
Finding Y
Vocabulary
100
What type of association does this graph have?
Negative.
100
Based on the graph, if Joe earned $400, how many hours did he work?

25 hours
100
What is the correlation between length of running start and distance of jump?

positive: the further you run the further you jump
100
Using the scatterplot below, come up with a reasonable estimate for y when x = 5
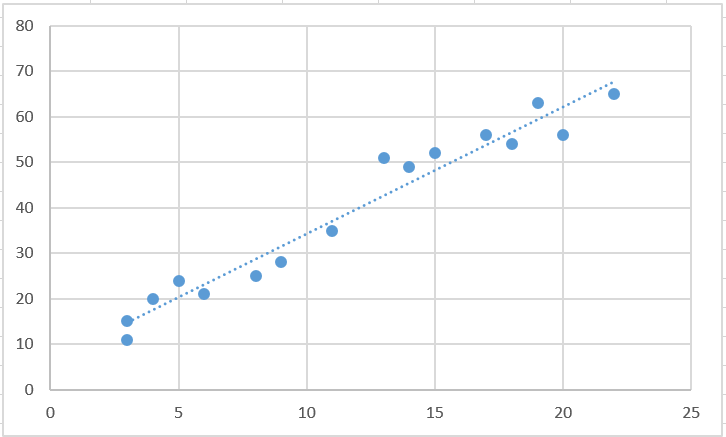
About 20 or 21
100
A graph with points to show the relationship between two sets of data
Scatter plot
200
If a scatterplot has no association then...
...its ordered pairs have no predictable pattern
200
About how many male math teachers were there in 2006?

35
200
Describe the correlation in the graph shown.

Weak Negative
200
Using the scatterplot below, come up with a reasonable estimate for x when y = 60
Around 19 or 20
200
A group of points that occur together.
Cluster
300
What is the type of correlation?

no association
300
Mrs. Collins made a scatterplot to show the relationship between the number of absences and a student’s final exam score. Based on this scatterplot, a student with 6 absences should get approximately what score on the final exam?

76
300
What type of correlation does this graph have?

positive
300
Using the scatterplot below, come up with a reasonable estimate for y when x = 13
Around 40-45
300
A data point that is very different from the rest of the data
Outlier
400
Describe the association between the number of lanes rented and the number of people bowling.

Positive linear association
400
The scatter plot shows the relationship between the number of chapters and the total number of pages for several books. Use the trend line to predict how many chapters would be in a book with 180 pages.

18 chapters
400
What type of correlation does this scatter plot show?

negative linear association
400
Using the scatterplot below, come up with a reasonable estimate for y when x = 10
Around 20
400
A line on a scatter plot that helps show the correlation between data sets more clearly
Normally splits the data set in half
Line of best fit
500
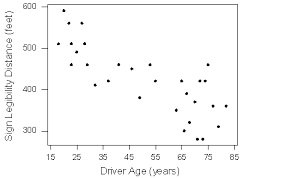
Describe the association for the graph.

Non-Linear and No association
500
What is a line of best fit used for?
To make predictions
500
What type of correlation (association)?
The outside temperature and the amount of layers you wear.
Negative correlation
500
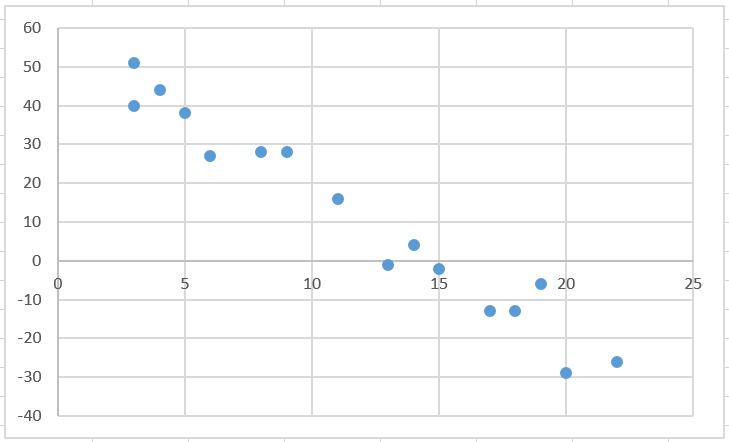
Using the scatterplot below, come up with a reasonable estimate for x when y = 10
Around 12
500
Word describing the association between a set of data
Correlation