Associations
Interpretations
Trend Lines
Predictions
Frequency Tables
100
The association described in the scatter plot:
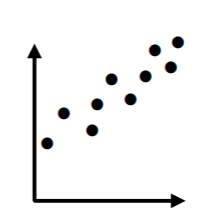
What is a positive association?
100
A point that does not fit the overall pattern or trend.
What is an Outlier?
100
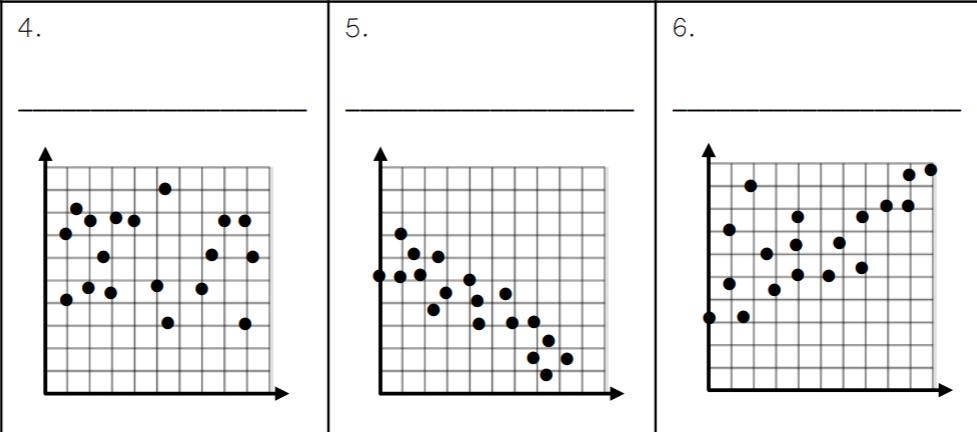
The graph that demonstrates a good line of fit (trend line)
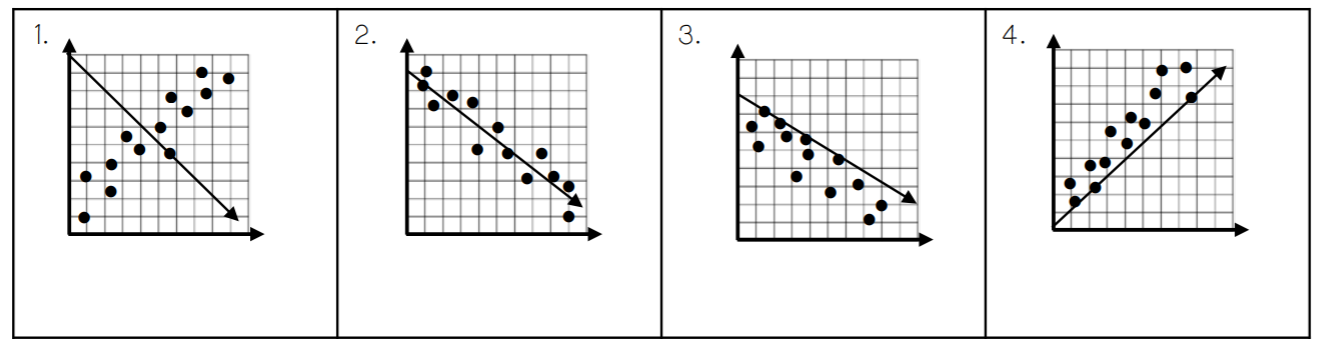
What is Graph 2?
100
The equation y=11x+12 represents the number of retail stores in a city over the years where x represents the years since 1990 and y represents the number of stores.
Find the number of stores in 1990.
What is 12?
100
The total number of people surveyed.

What is 100?
200
Association in which as one variable increases, the other also increases.
What is a Positive Association?
200
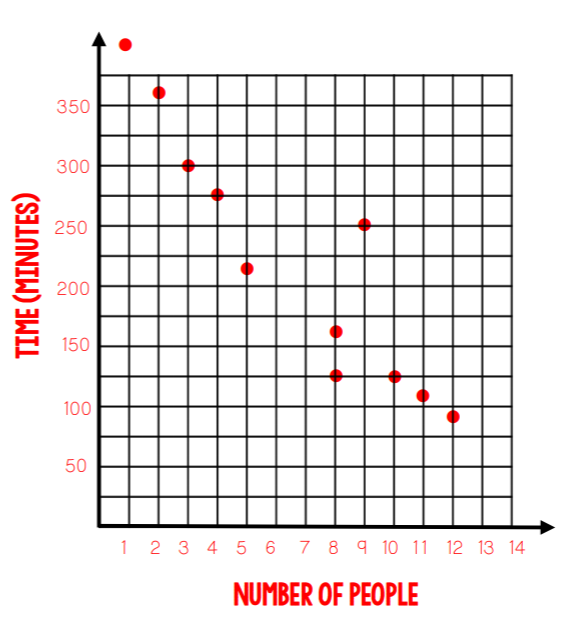
The point that is an outlier in the graph:
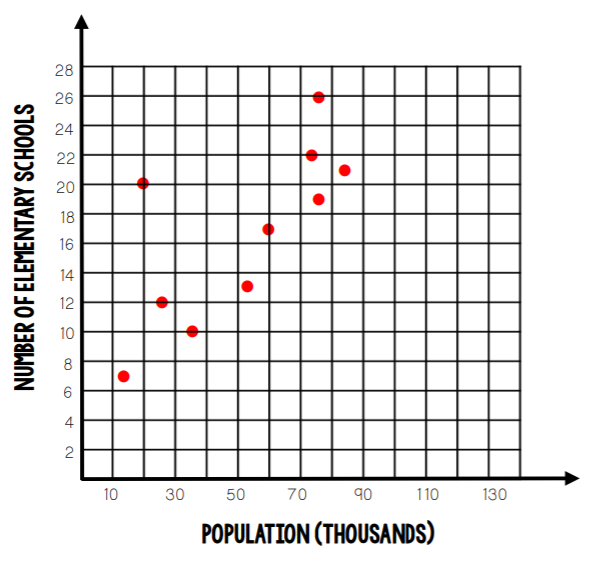
What is (20, 20)?
200
The y-intercept of the trend line.
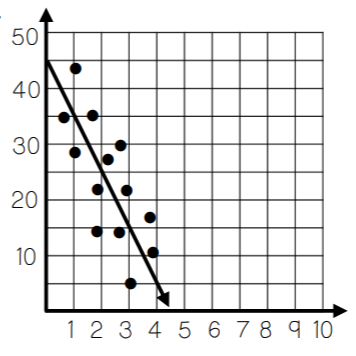
What is 45?
200
The equation y=11x+12 represents the number of retail stores in a city over the years where x represents the years since 1990 and y represents the number of stores.
Find the number of stores in 2010.
What is 232 stores?
200
How many more males said that they prefer winter to summer?

What is 4?
300
The association between a person’s height and that person’s IQ.
What is No Association?
300
The graph that demonstrates a positive, non-linear association:

What is Graph 3?
300
The slope of the trend line.

What is 12.5 or 25/2?
300
The equation y=11x+12 represents the number of retail stores in a city over the years where x represents the years since 1990 and y represents the number of stores.
Find the year there were 133 stores.
What is 2001?
300
Of the left-handed people, how many more prefer pancakes over waffles?
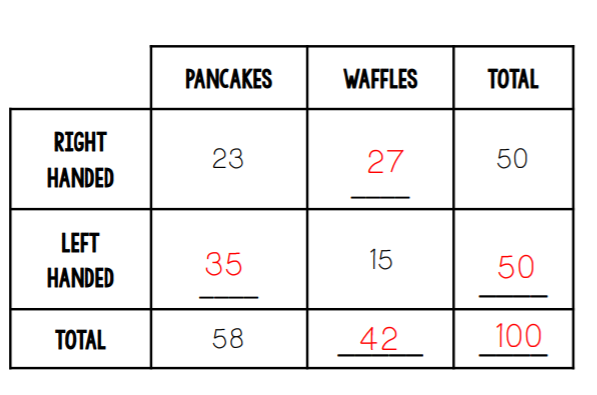
What is 20?
400
The association between the number of absences a student has and that student’s GPA.
What is a Negative Association?
400
The correct statement for this graph:

What is Statement 8?
400
The equation of the trend line:

What is
y=-1/3x+8?
400
The year you would expect 5% of the population to smoke cigarettes
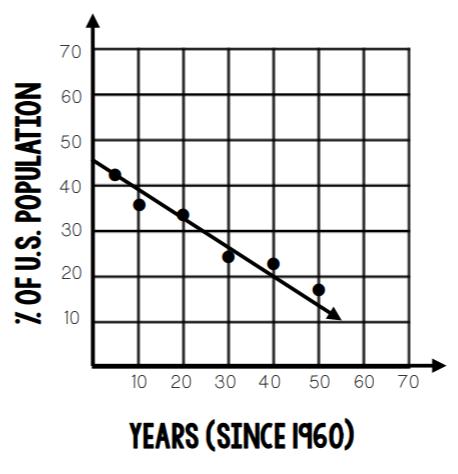
What is 2024?
400
Of the people surveyed, the relative frequency of those who have gotten a speeding ticket.
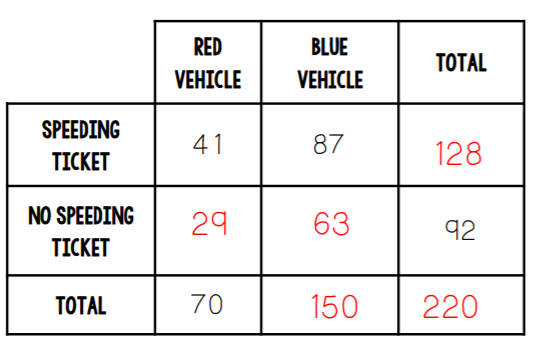
What is 58%?
500
The association when data points are close together.
What is a Strong Association?
500
The scatter plot that can be used to show the relationship between the number of students in a school and the number of unused lockers
What is Graph 5?
500
What the slope represents in the context of this situation (Be Specific!)
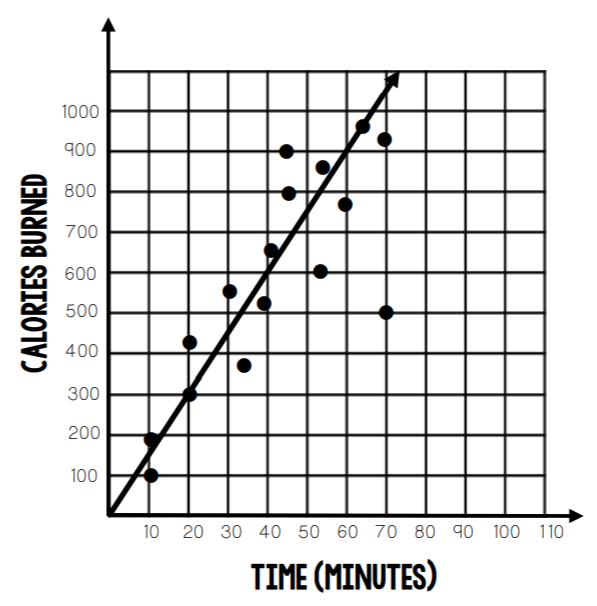
What is people burn 15 calories every minute?
500
The percentage you would expect to smoke cigarettes in 2016
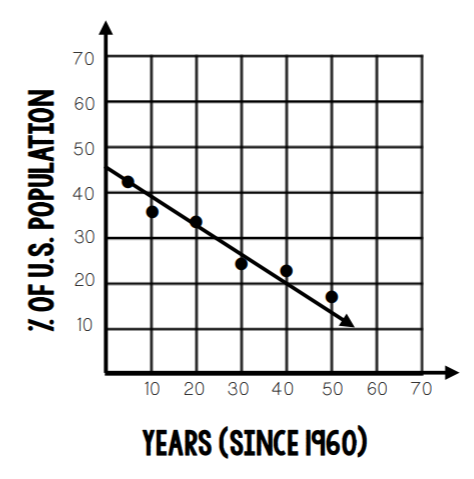
What is 10%?
500
Of the people who have kids, the relative frequency of those who do not have pets.

What is 35%?