Finding M & b
Equation of a line
Scatterplot Vocab
Read the Graph
Best Fit
100
State the slope and y-intercept from the equation:
y = 2x - 8
m = 2
b: (0 , -8)
100
Given slope and y-intercept, write the equation.
m = -7
y-intercept = 3
y = -7x + 3
100
A data point that is very different from the rest of the data
outlier
100
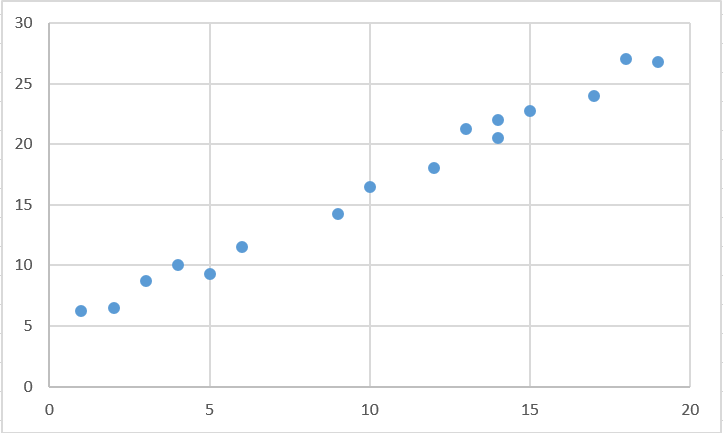
Using the scatterplot below, come up with a reasonable estimate for y when x = 5
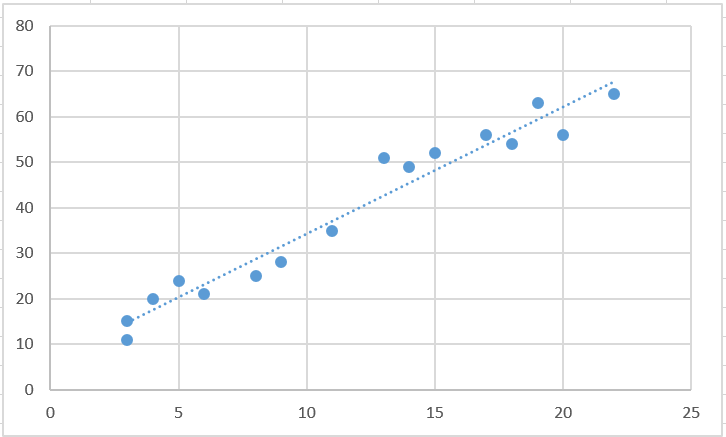
about 20 or 21
100
If one variable is increasing and another is decreasing, what type of association is it?
Negative Association/Correlation
200
State the slope and y-intercept from the graph.
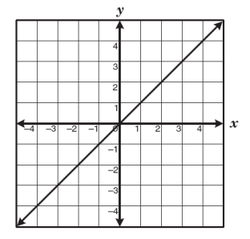
m = 1
b: (0 , 0)
y = 1x + 0
or
y =1x
200
Given slope and y-intercept, write the equation.
m = -8
b: (0 , -20)
y = -8x - 20
200
A line on a scatter plot that helps show the correlation between data sets more clearly
Normally goes through at least 2 points
line of best fit
200
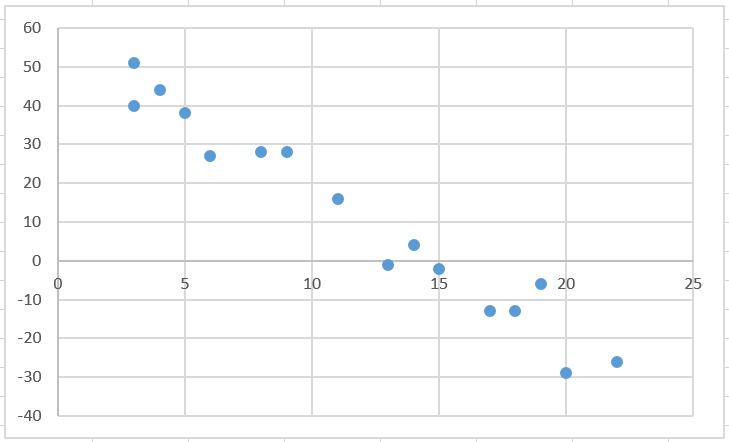
Using the scatterplot below, come up with a reasonable estimate for x when y = 60
around 19 or 20
200
Why do we draw a line of best fit?
To make a prediction beyond the scatter plot
300
(-3, 6) & (-3,4) Slope= ?
Slope = Undefined
300
Given the graph, write the equation.
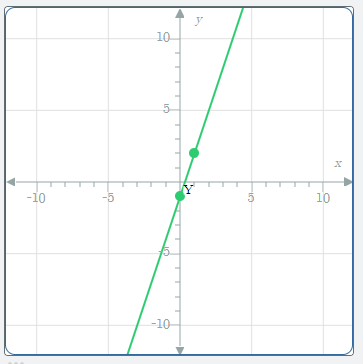
y = 3x -1
300
A group of points that occur together that follow the trend
cluster
300
Using the scatterplot below, come up with a reasonable estimate for y when x = 13
Somewhere from 40-45
300
What are two points on the line of best fit? 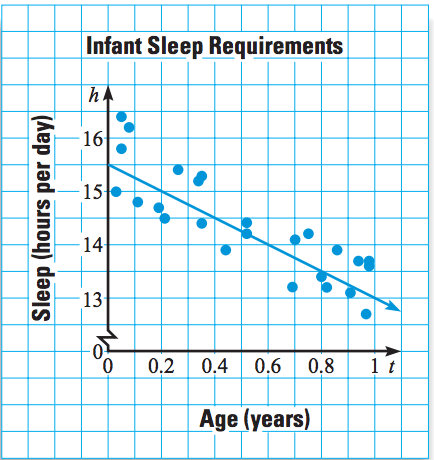
(0.2,15) (0.4,13) (0.6,14) (0.8,12) (1,13)
400
State the slope and y-intercept from the graph.
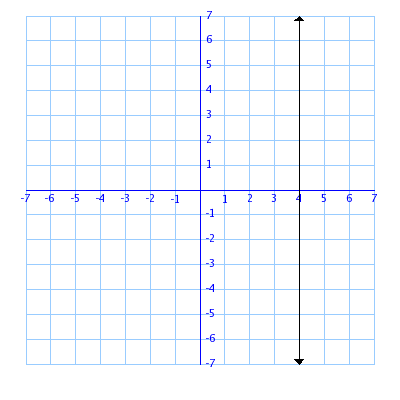
m = undefined
b: none
400
What is the equation of the line?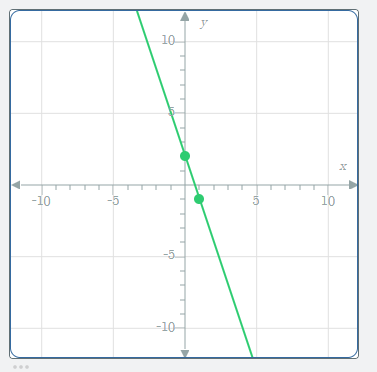
y=-3x+2
400
Describe this association.
Strong, Positive, Linear
400
Using the scatterplot below, come up with a reasonable estimate for y when x = 10
Around 20.
400
The equation of the line of best fit is y=-2.12x + 15.5, where x represents the age (in years) of an infant, and y represents the hours of sleep the infant needs. Predict how many hours of sleep an infant who is 6 months (0.5 years) needs.
14.4
500
Two points on the line of best fit are (4, 85) and (2, 70). Find the slope for the line of best fit using these points.
slope = 15/2
500
If you were going to graph the following line, what is the very first point you would plot?
y = 3x-4
y - intercept: (0 , -4)
500
Name the steps to arrive at the equation for the line of best fit in 4-5 steps
1) Draw a line
2) Pick 2 points on the line
3) Find Slope
4) Find y intercept
5) replace m and b in equation y=mx+b
500
Find the equation of the line of best fit 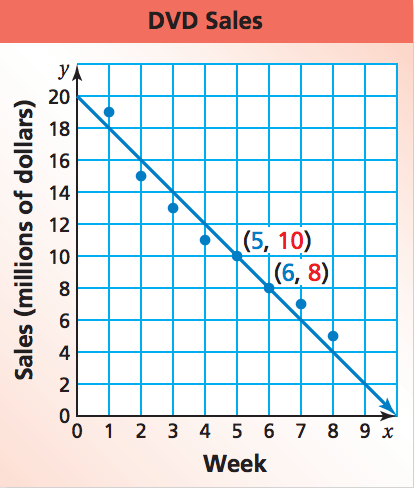
y=-2x+20
500
The equation of the line of best fit for a scatter plot is y=12x - 216, where x represents the temperature outside and y represents the sales of the ice cream shop. Predict the temperature outside if the ice cream shop had a total sales of $700.
76.33