Clusters
Outliers/Clusters
Positive Association
Negative Association
(Non)Linear Association
100
What does a cluster look like on the graph?
Close group of dots
100
What is an outlier?
Data point that differs significantly from other observations.
100
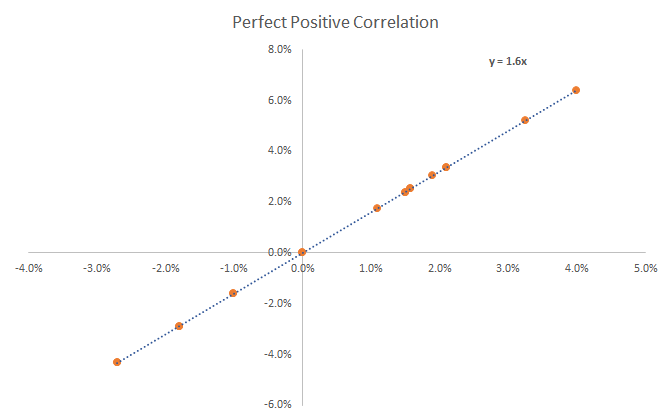
What is a positive correlation?
If the trend line is increasing it is positive.
100
What is negative correlation?
If the trend line is decreasing it is negative
100
What does linear association mean?
The straight or nearly straight trend line on a scatterplot.
200
Draw an example of a scatterplot with clusters
There should be a clump of points somewhere
200
Draw an example of a scatterplot with an outlier
There should be at least one point away from the others.
200
Might lemonade sales and warm weather have a positive correlation?
Yes, both increase
200
Is this a negative association?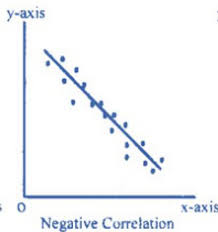
Yes, the trend line is decreasing.
200
What is a nonlinear correlation?
When the trend line on a scatterplot is not in a line.
300
Draw an example of a scatterplot without clusters.
There should not be dots touching/super close.
300
Draw an example of a scatterplot without an outlier.
There should not be any points away from the rest.
300
Draw an example of positive correlation.
increasing
300
Draw an example of negative correlation
Trend line is decreasing.
300
Is the trend line linear or nonlinear?

Linear
400
What does a cluster tell you about the data in the scatterplot?
Some data was very closely related/similar.
400
What does an outlier tell you about the data in the scatterplot?
At least one data point is very different than the trend.
400
Give a real world example of when there would be a positive correlation
Both things increase
400
Is this negative correlation?
No, the trend line is increasing.
400
Draw an example of a nonlinear relation
Not a straight line
500
Give an example of a real world situation that would lead to a cluster on a scatterplot.
Answers will vary.
500
Give an example of a real world situation that would lead to an outlier on a scatterplot.
Answers will vary
500
Is this a positive association?

No, it is a negative association.
500
Is this a negative association?
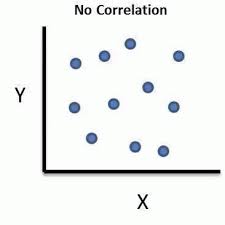
No, there is no association
500
Is the line linear or nonlinear?
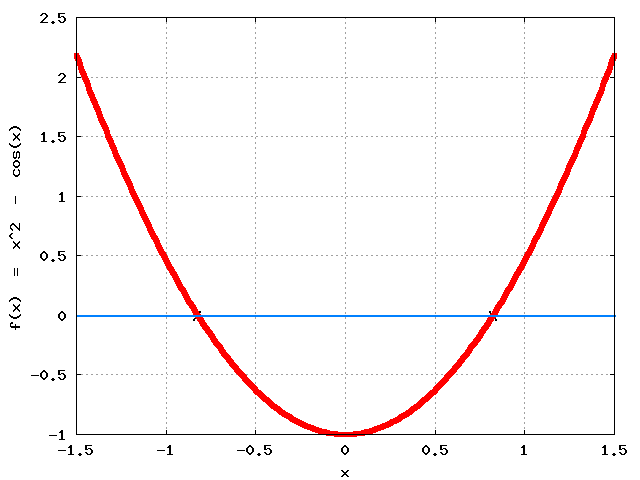
It is nonlinear because it bends.