Correlations
Predictions
Scatterplots
Line of Best Fit
Correlations
100
Hours of exercise and weight loss
What is positive
100
What was the temperature when the beach had the most visitors?

94 degrees it had 600 vistors
100
Draw a scatterplot showing a no correlation
Something with dots all over
100
Define or describe a line of best fit.
A line on a graph showing the general direction that a group of points seem to follow.
100
What type of correlation? 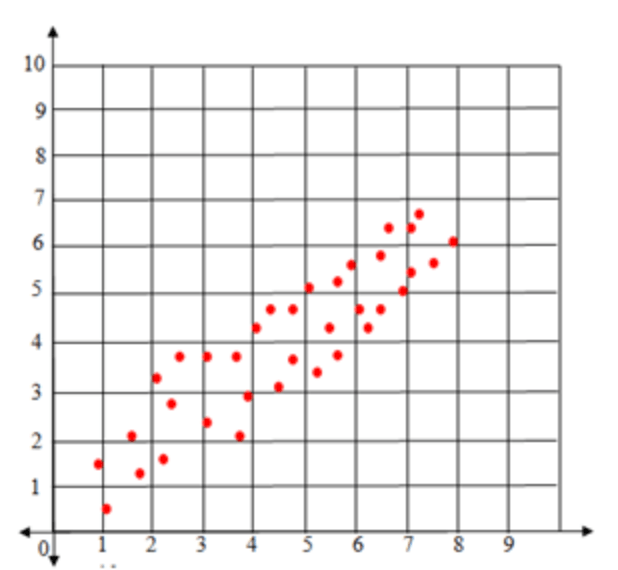
Positive Correlation
200
Temperature outside and number of pets
What is no correlation
200
For someone to who studied 1 hour what was their score on the final exam? 
50%
200
Draw a scatterplot showing a weak positive correlation
Dots going up from left to right but not close together
200
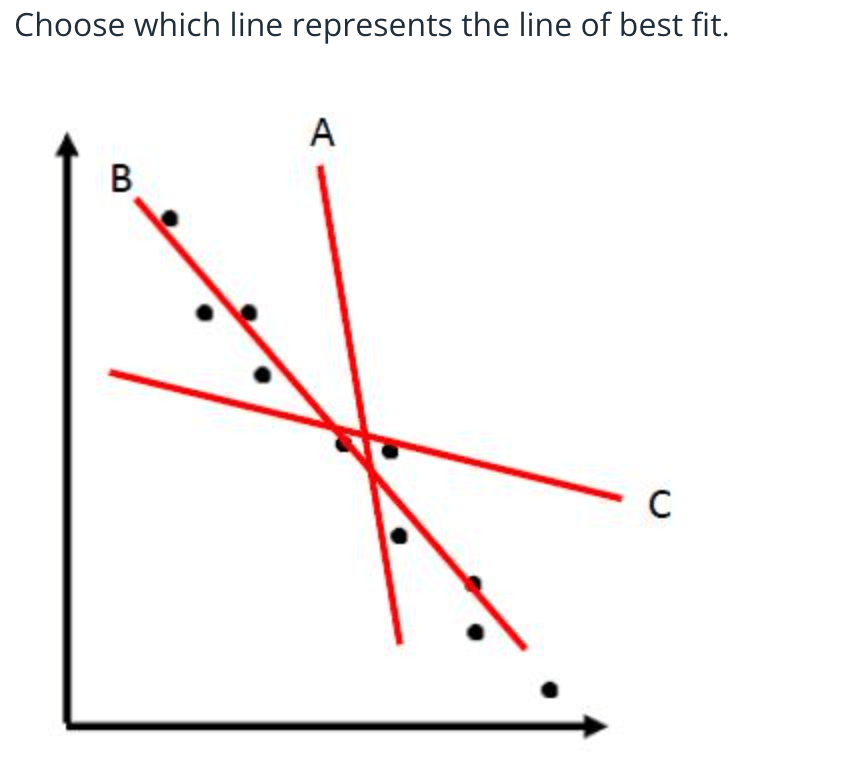
B
200
What type of correlation 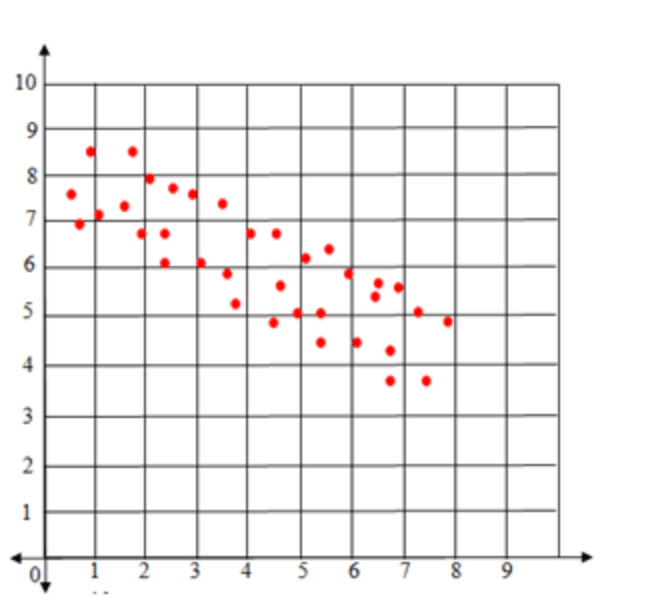
Negative Correlation
300
Time spent doing homework and number of missing assignments
What is negative
300
What is the score for someone who studied 5 hours? 
90%
300
Draw a scatterplot showing a strong positive correlation
Dots going up closer together from left to right
300
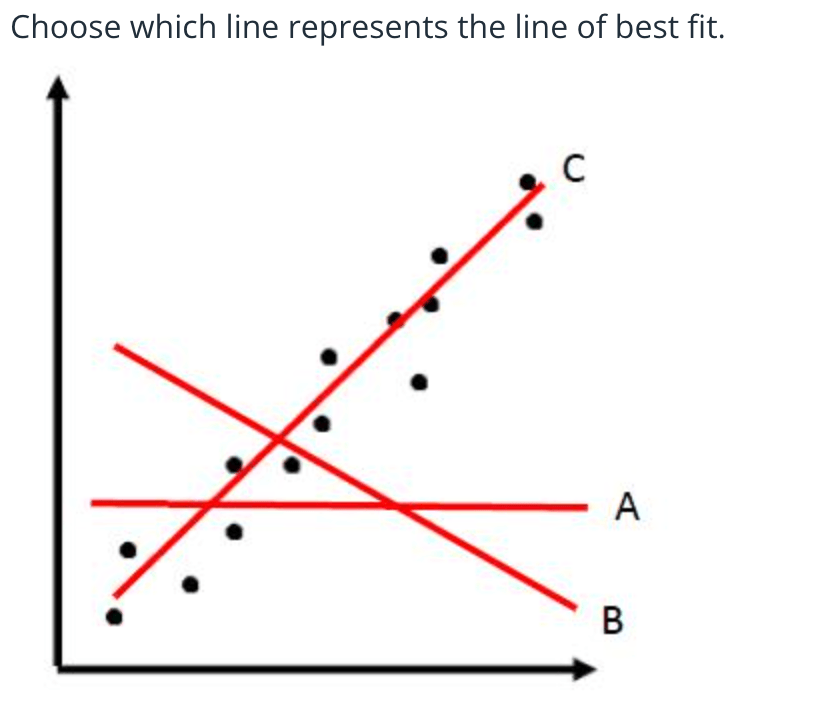
C
300
What type of correlation be specific? 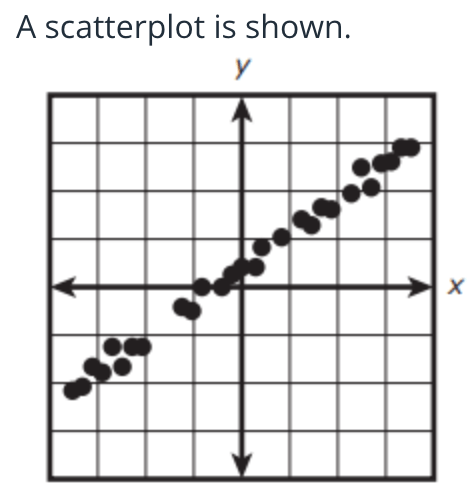
Strong Positive Correlation
400
What type of correlation is show in a scatterplot where y tends to increase as x tends to increase?
Positive Correlation
400
If the temperature is 90 degrees about how many visitors should the beach expect? 
Between 350-400
375 would be the best answer
400
Draw a scatterplot showing a strong negative correlation
Dots going down from left to right close together.
400
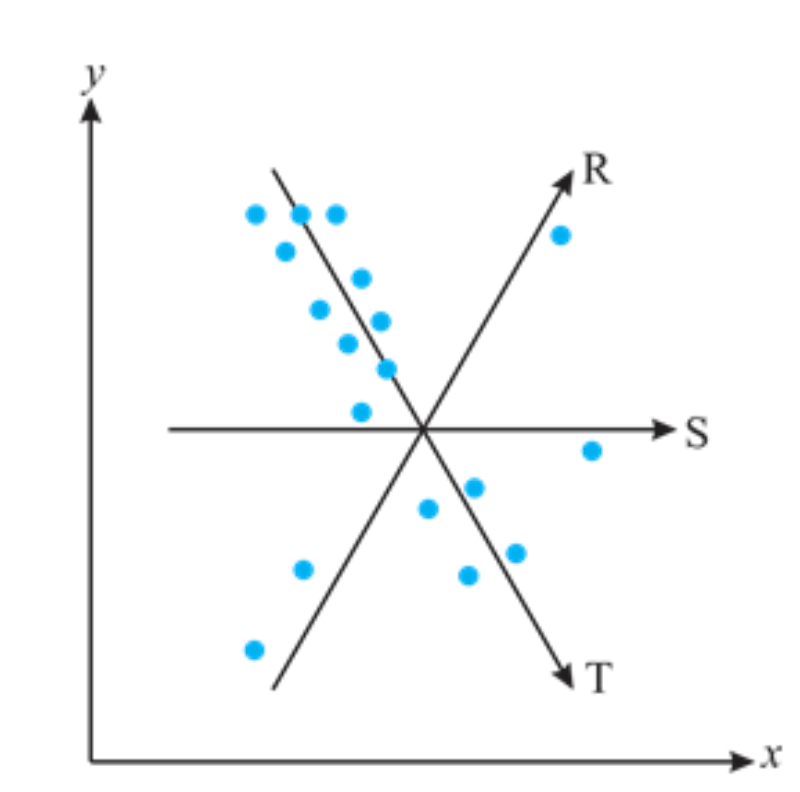
Line T
400
Describe the scatterplot below. What is happening in this situation. 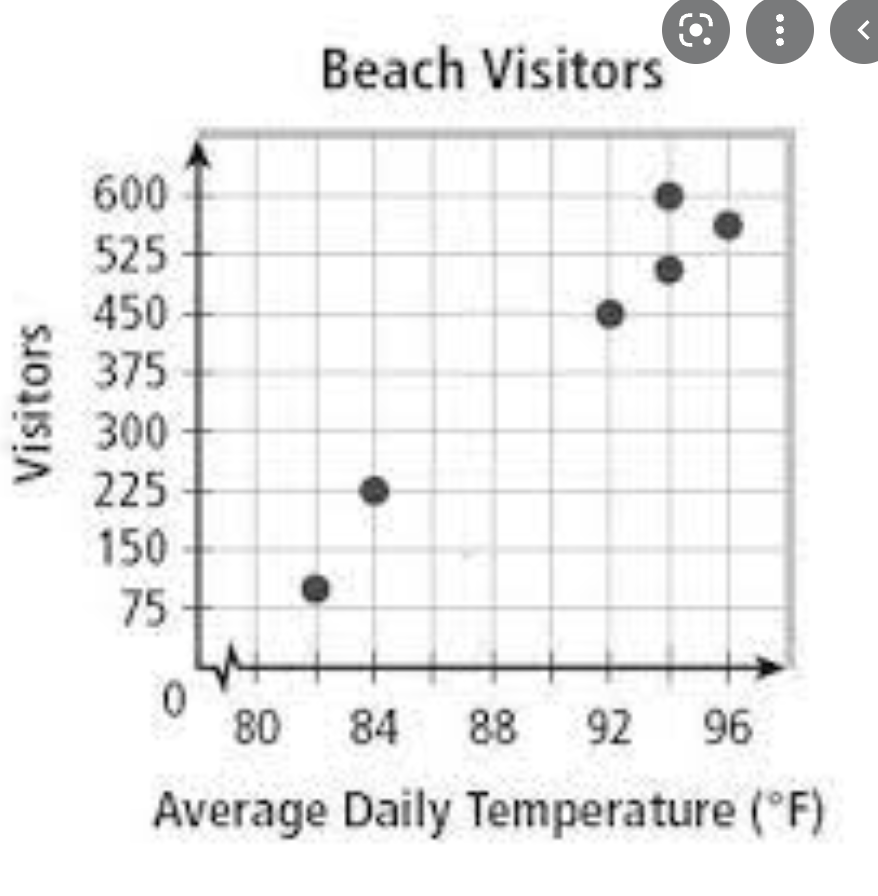
As the average daily temperature increase, the number of Beach goers also increases.
(As X increases, Y increases)
500
What type of correlation does a scatterplot show where y tends to decrease as x tends to increase?
Negative Correlation
500
How many hours should someone study to get an A or above a 90% on the exam? 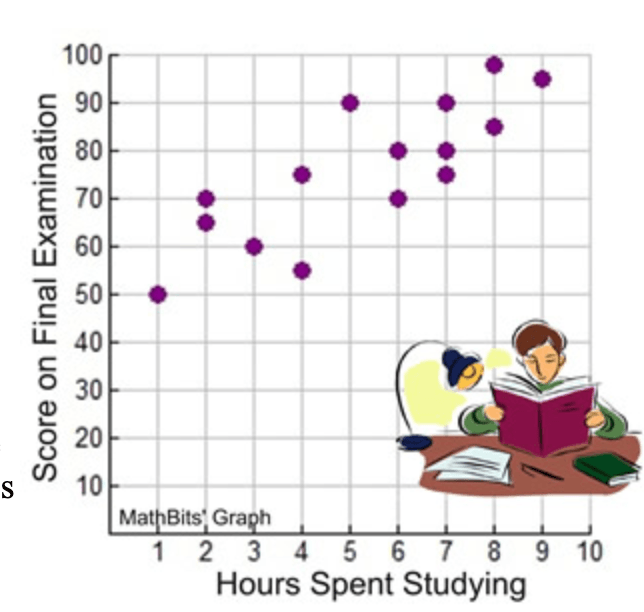
At least 5 hours
500
Draw a scatterplot showing a weak negative correlation
Dots going down from left to right not close together.
500
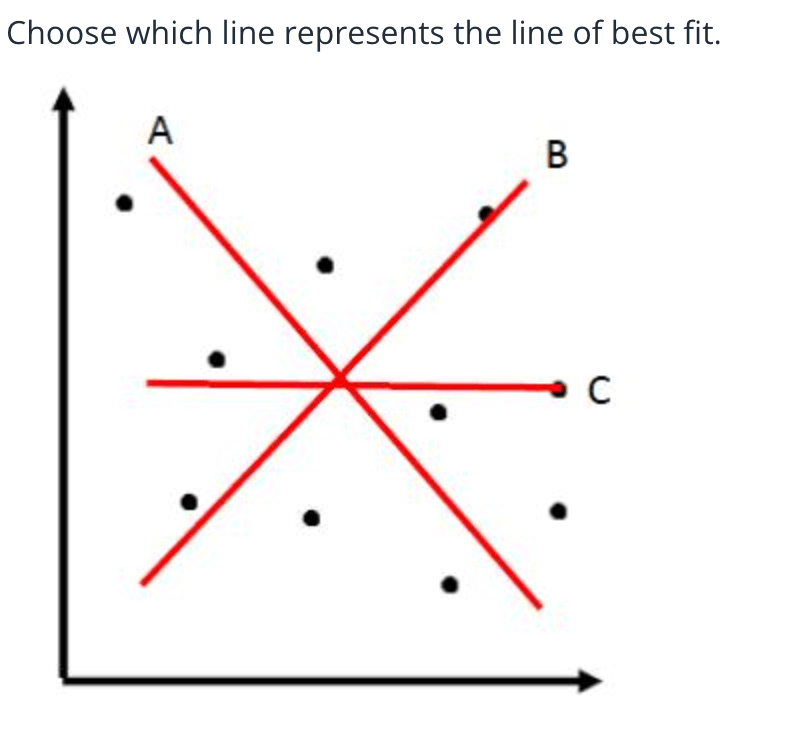
There is no correlation there is no line of best fit
500
Describe the scatterplot in relation the the situation.

If the student increases the number of study hours their final exam score also increase.
(As X increase, Y increases)