Intro to Science
Graphing data
True or False
Important Scientific figures
Vocab
Lab tools
100
branch of science: the study of matter, energy, and their physical properties
Physical science
100
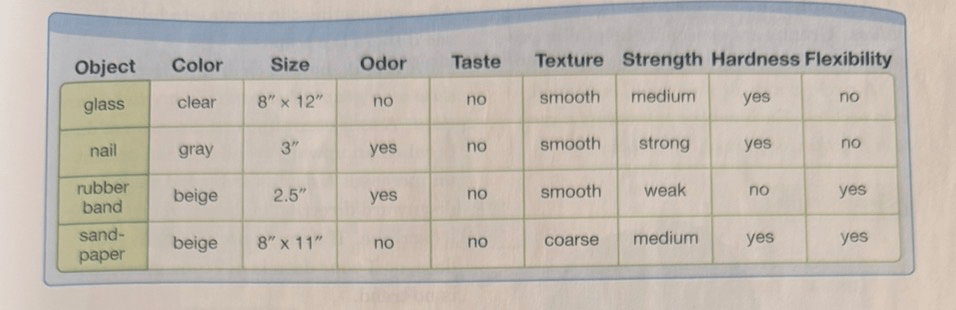 What concept map is this?
: table that sorts and organizes properties or data
Information Table
100
The factors in an experiment that can be controlled are called variables
true
100
Who reasoned that the earth and all the planets orbit the sun?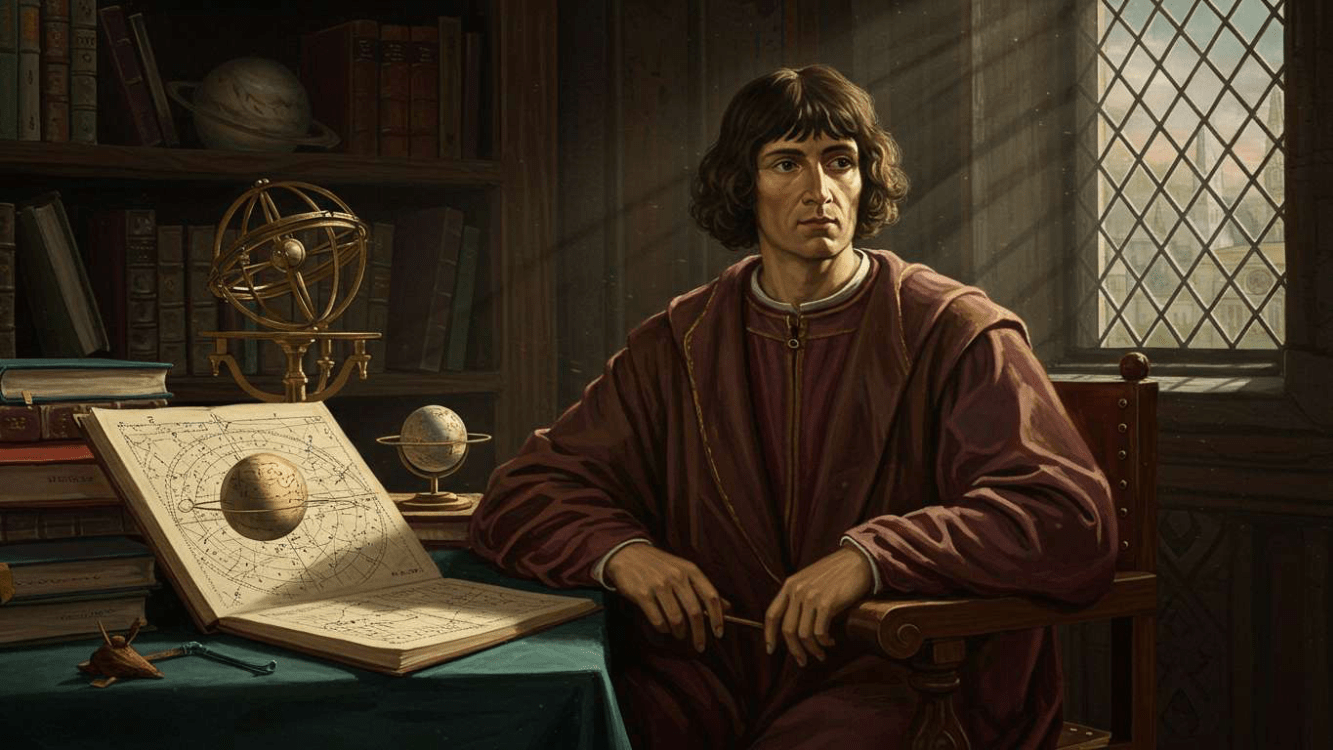
Nicolaus Copernicus
100
an orderly step by step process of finding scientific facts
the scientific method
100
measuring heat energy changes during an experiment
thermometer
200
branch of science: study of earth, its atmosphere, and outer space
earth science
200
What concept map is this?
: charts that link connecting ideas and supporting ideas to main ideas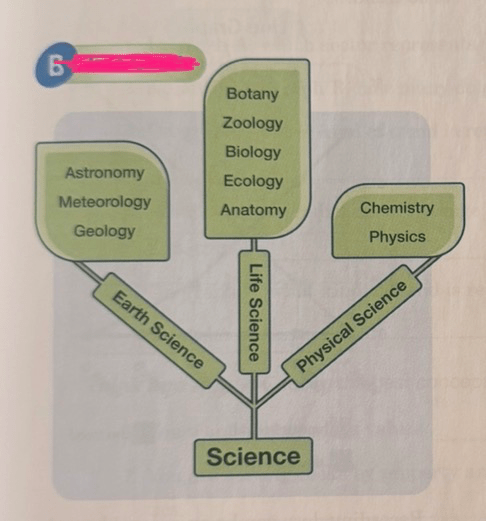
Tree Chart
200
The factor in an experiment that is measured or observed is the independent variable.
false, dependent variable
(independent variable: is the only factor in an experiment that is changed)
200
Who reasoned that the earth was the center of the earth?
Greek mathematician - Ptolemy
200
to look closely at something in order to learn facts
investigate
200
comparing the mass of two items
scale
300
branch of science: the study of living things
Life science
300
What concept map is this?
: show similarities and differences between a number of things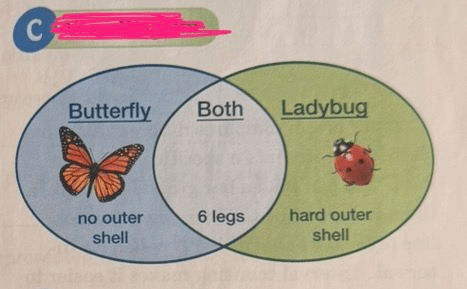
Vin Diagram
300
The factors in an experiment that stay the same are the common variables.
false, Controlled Variables
300
Who introduced the scientific method?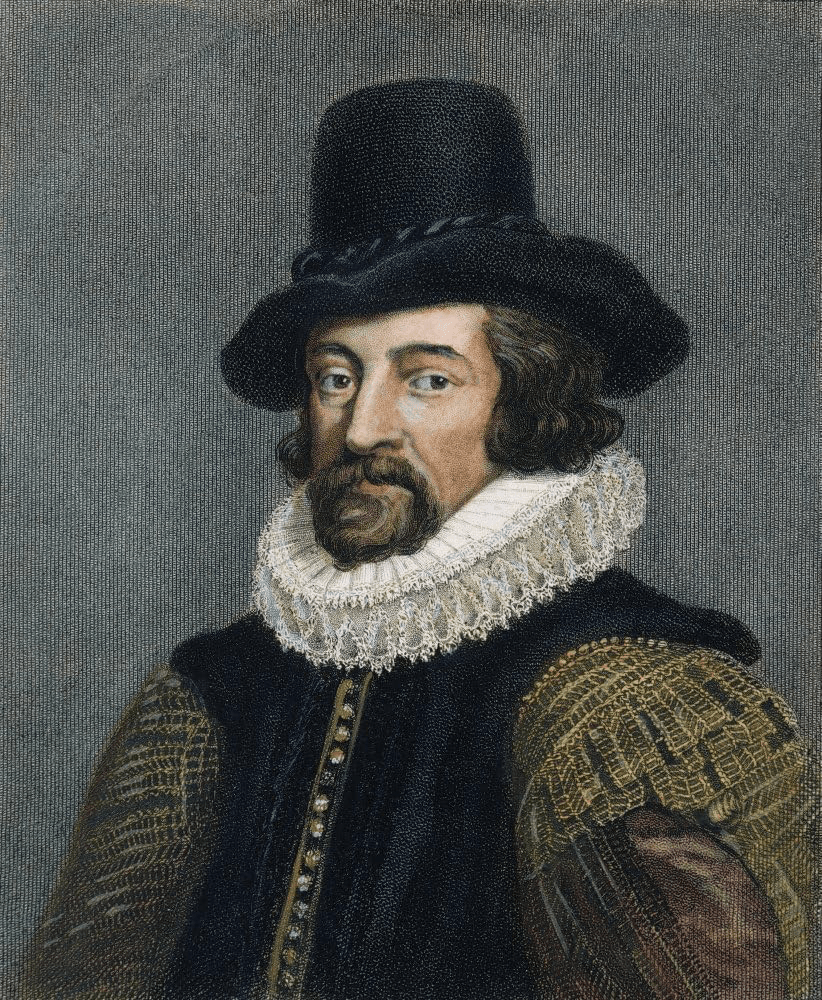
Sir Francis Bacon
300
a collection of facts
data
300
you are mixing two materials, explain
flask, the narrow neck reduces spills and gas release
400
What are the 3 branches of science?
Earth science, Life science, Physical science
400
What concept map is this?
: demonstrate ideas, facts, and concepts and show how they are related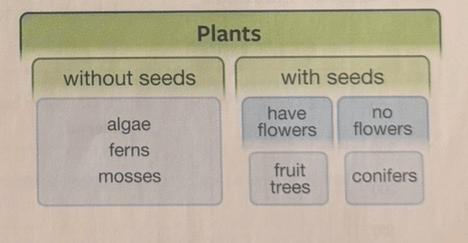
Graphic Organizer
400
The group in an experiment used as the standard is the control group.
true
400
decision based on evidence
conclusion
400
you are separating rock from sand
strainer
500
Order the steps of the scientific method from beginning to end.
1. Observe, ask questions
2. Form a hypothesis
3. Experiment, gather data
4. Study data, reach a conclusion
500
 What concept map is this?
:type of concept map that show the progression of a process as well as cause and effect
Flow Chart
500
When there is not enough evidence for a scientist to form a conclusion, we say the data is conclusive
false, the data is inconclusive
500
specific description of why some part of nature always behaves
law
500
you are comparing the speed of two balloon-propelled rockets, explain
stop watch, can measure down to the milli-second providing accurate data
600
Identify what type of graph is
A. ______
B. ______
C. ______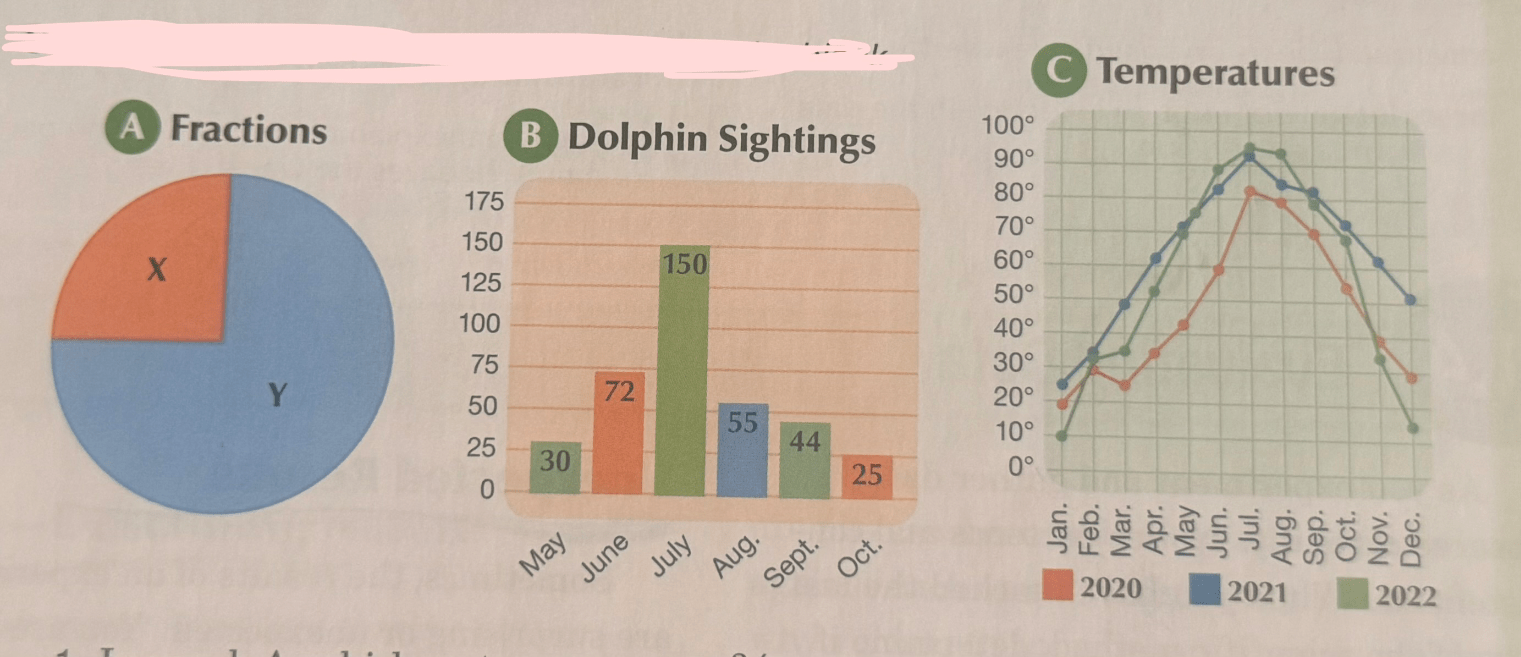
A. Circle Graph
B. Bar Graph
C. Line Graph
600
I form an experiment on a new medication that grows hair. Group 1: recieved fake candy pills. Group 2: receives the new hair growth medication.
True or false:
Group 2: is the control group.
false, group 1 is the control group as they are staying the same. They are not receiving the variable which is the new hairy growth medication
600
general explanation of why some part of nature behaves the way it does
Theory
600
you are observing cells, explain
microscope, you can not see cells with the human eye