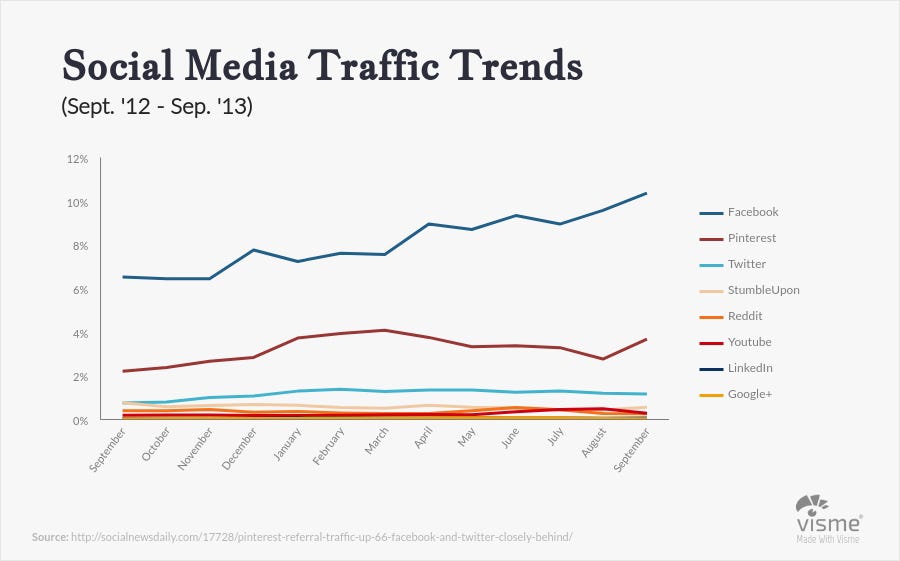
The first step/steps of the scientific inquiry process is?
What is make an observation and ask a question.
The x axis represents which variable?
What is the Independent variable
What are the two types of variables stated in a hypothesis?
What is Independent and Dependent.
What are the two types of Observation?
Qualitative and Quantitative
True or false. The reasoning portion of a CER is written in paragraph form?
What is True
A prediction about what will happen in an experiment.
What is a hypothesis?
The Y axis represents which variable?
What is the dependent variable
What is the responding variable or the thing that the scientist is measuring?
What is the Dependent Variable
A statement that is based in assumptions about observations that have been made are known as?
The higher the temperature of the water, the faster the egg will boil. a. Independent Variable (IV): b. Dependent Variable (DV): c. Constant Variable (CV):
Independent Variable (IV): Temperature b. Dependent Variable (DV): Egg c. Control/Constant Variable (CV): how much water, the type of egg
Two types of charts or graphs you could make when you organize your data in an experiment.
What are line, bar, pie/circle ane picture graphs?
What is the term we use to describe the manipulated variable or factor that the experimenter intentionally changes?
What is Independent Variable.
Observation or inference? There are 10 birds in the tree outside the window.
What is observation
Students of different age groups were asked to put the same jigsaw puzzle together,
they were timed to see how long it took.
a. IV:
b. DV:
c. CV:
a. IV: Age Group
b. DV: the time it took to put the puzzle together
c. CV: jigsaw puzzle
The final answer to your question that you think is true based on your results. This is a summary paragraph to pull all of our information together to give to our reader.
What is a conclusion/reasoning?
 What month has the most birthdays?
What is June
In an experiment this is the standard to which results are compared is known as?
What is the control
What is an inference
The higher the temperature of the air in the oven, the faster a cake will bake. a. IV: b. DV: c. CV:
IV: Temperature of oven
DV: Cake baking time
CV: Ingredients
Information gathered by reading books, looking on the internet or talking to other people.
What is background research?
What are the two most popular social media websites?
What is Facebook and YouTube
Find the independent and dependent variables in the following experiment: The blood pressure of a soldier is measured while he is resting. The soldier is then exposed to a stressful environment and his blood pressure is measured again.
What is Independent variable is the environment the solder is in. Dependent variable is the blood pressure of the solder.
Observation or inference? The children must love homework because they all completed it.
What is an inference
Fish Eggs: A scientist knows that the percent of fish eggs that hatch is affected by the temperature of the water in the aquarium. She is attempting to identify which water temperature will cause the highest percentage of fish eggs to hatch. The scientist sets up 5 aquariums at the following temperatures: 10℃, 20℃, 30℃, 40℃, and 50℃. She adds 50 fish eggs to each aquarium and records the number of eggs that hatch in each aquarium. a. IV: b. DV: c. List 3 variables that should be controlled (held constant):
IV: Water temperature
DV: Fish eggs hatched
CV: Amount of water, type of fish, size of aquarium