Steps 1
Steps 2
True / false
Variables
Determine variable from example
data graphs / tables 1
data graphs / tables 2
100
Which step Gathers information by using your senses
Observation
100
A series of steps designed to help you solve problems and answer questions
A) scientific method
B) experiment
C) hypothesis
D) observation
A) scientific method
100
True or False: Biologists are the only individuals who use the scientific method
False - WE ALL USE IT
100
In an experiment, scientists try to change only one variable at a time. All the other conditions are kept the same so the results are fair and only the tested variable causes any change. What are the conditions that stay the same throughout the experiment called?
a. independent variable
b. dependent variable
c. constant
d. control
c. constant
100
A scientist conducted an experiment to determine how the amount of salt in a body of water affects the plants that can live in the water. In this experiment the independent variable is
A) the types of plants
B) the amount of salt in the water
C) the amount of water
D) the fish
the amount of salt in the water
100
What type of data visual is this?
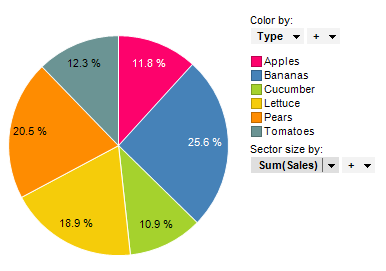
Pie chart
100
What type of graph is this?
bar graph
200
The step of the scientific method that comes after OBSERVATION and is a reaction to what you notice about the natural world. It is a scientific question (Since i gave you "question", use one of the other possible two names of this step)
Purpose or Problem
200
What is a hypothesis?
An educated guess or prediction of what you think the outcome will be
200
True or False: In a scientific experiment, the independent variable is the factor that the scientist changes on purpose.
True
200
The variable that is changed/manipulated in an experiment.
A. | Dependent |
B. | Independent |
C. | Control |
D. | Uncontrolled |
b. independent
200
Different preservatives were tried in foods to determine which best restricted the growth of molds. What is the dependent variable?
Growth of Mold
200
A graph that shows quantitative data over time like the one below

line graph
200
A graph that shows percentages/parts of a whole
pie graph
300
What is the step of the scientific method that comes after analyze data and results?
Conclusion - accept or reject hypothesis
300
Fill in the blank, Hypotheses are in the format: "If...._______...."
Then
300
True or false. The dependent variable is always the variable that the scientist controls directly.
FALSE
independent variable is CHANGED
300
what changes as a result of the independent variable manipulation in experiments (what we measure)
dependent variable.
300
A student wants to see if music helps plants grow taller. She gives one plant water and sunlight but no music, while the other plant gets the same water and sunlight plus daily music. What is the control group?
The plant with no music.
300
Which pot had more overall growth? The pot with 2 plants or the pot with 4 plants?

Pot with 2 plants had more growth than the pot with 4 plants
300
On a plot, The independent variable is always on the x-axis and dependent variable is always on the y-axis. What is dependent variable?
Extension of a wire
400
Which step includes results of the experiment with observations, measurements, graphs, and tables?
Analyze data - make graphs/tables
400
In the results analysis step, What type of data is Descriptive, categorical or Physical Data that is shown with a bar graph or pie chart?
Qualitative
400
True or false. On a properly labeled graph, the independent variable is plotted on the y-axis and the dependent variable is on the x-axis.
FALSE
x-axis: independent
y-axis: dependent
400
the variable in the experiment that the independent variable is not applied to,
neutral / unchanged
serves as a baseline used as the comparison in an experiment
Control group/controlled variable
400
Students test how temperature affects the rate sugar dissolves in water. They use the same amount of sugar, same type of cup, and stir each solution the same way. The only thing that changes is the water temperature.
What are the constants? Name all 3.
The amount of sugar, type of cup, and stirring method.
400
A student hypothesized that if they added more plants to the same pot, then the plants would grow faster and have more overall growth. Does their data below REJECT or SUPPORT their hypothesis?
REJECT
400
What is being measured on the x axis?
Hours
Time
Battery use
500
What are the steps to the scientific method?
Observation
Question
Research
Hypothesize
Experiment
Analyze
Conclude
500
In the results analysis step, What type of data is Numerical Data and Measurements that is visually represented on a line graph?
Quantitative
500
The purpose of Repeating an experiment many times (hundreds of times) and getting similar results is to increase the reliability of the data and show that it was not a one time fluke and the results are the same.
True
500
Scientists measure the 1. _____________ (independent/dependent) variable to determine the effect of the 2. ____________ (independent/dependent) variable.
dependent
independent
500
A biologist studies whether a new medicine reduces sneezing in people with allergies. Group A takes the medicine, while Group B takes a sugar pill (placebo). Both groups are treated the same otherwise.
Which variable is the placebo?
Control
500
Describe the overall trend: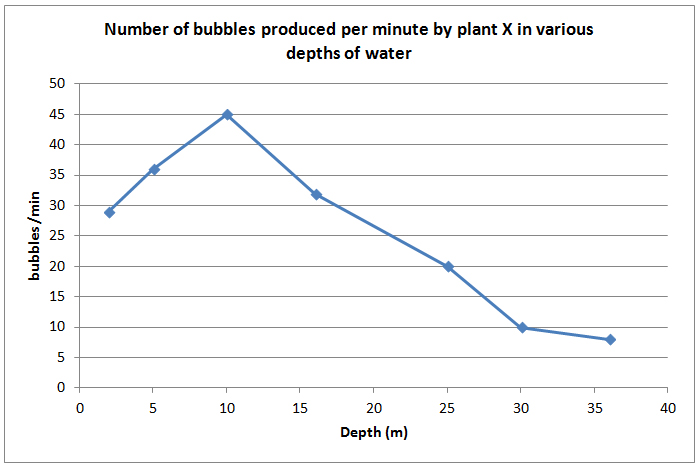
Decreases
Goes down
Inverse
500
What is the independent variable?

Water depth