Independent Variable
Dependent Variable
Constant
Control
Graphing
100
What was the independent variable in the penny lab?

The independent variable was the kind of water! Soapy or regular tap water
100
What was the dependent variable in the penny lab?

The dependent variable was the number of drops.
100
What was one constant in the penny lab?
One constant was the PENNY. Also: the dropper, the place, the person conducting the experiment.
100
What was the control in the penny lab?
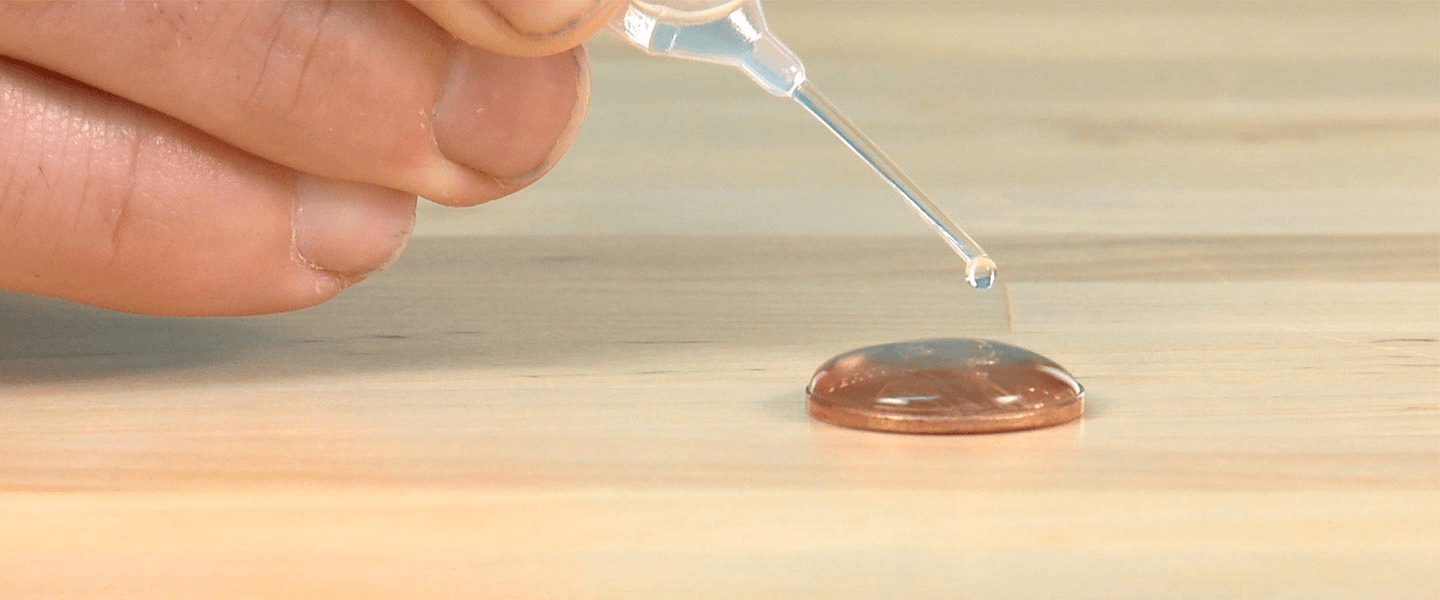
The control in the penny lab was the tap (normal) water.
100
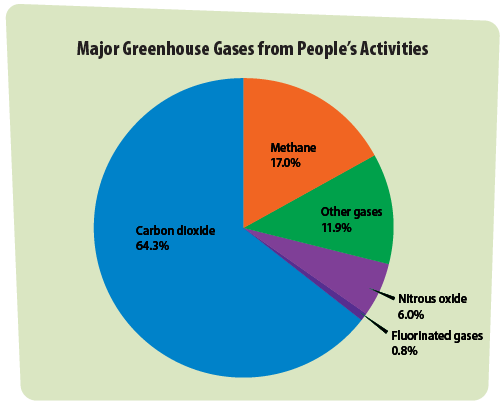
I want to show percentages. What kind of graph should I use?
You should use a circle graph/pie chart.
200
What was the independent variable in the pasta lab?
The independent variable was the kind of pasta: spaghetti, fettucine, or angel hair
200
What was the dependent variable in the spaghetti lab?
The dependent variable was the number of pennies.
200
What was one constant in the spaghetti lab?
One constant was the distance between the chairs. ALSO: the brand of pasta, the cup, the place, etc.
200
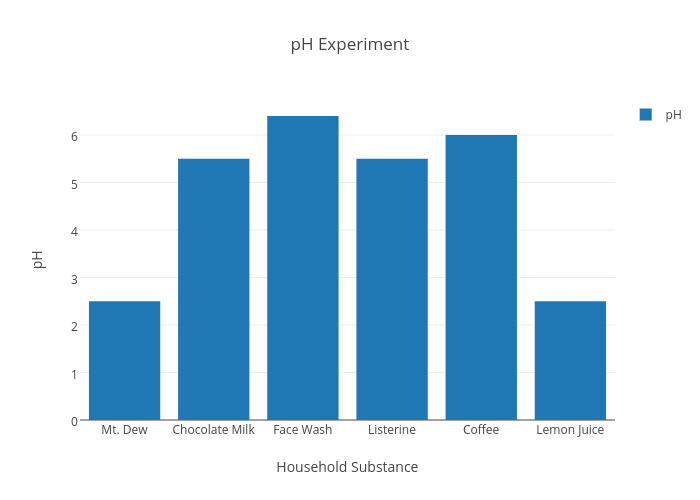
What was the control in the pH lab?
The control in the pH lab was water. It is normal, neutral pH (7).
200
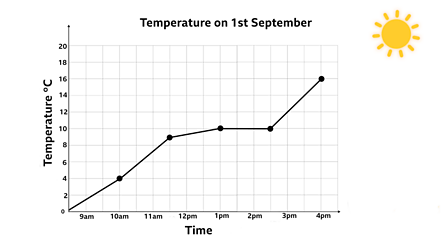
I want to show change over time. What kind of graph should I use?
You should use a line graph.
300
What was the independent variable in the pH lab?
The independent variable was the substance: water, lemon juice, coke, vinegar, baking soda, cleaning fluid, milk
300
What was the dependent variable in the M&M's lab?
The dependent variable was the number of each color of M&M's.
300
What was one constant in the pH lab?
One constant was the pH paper used. Also: the place, the people conducting the experiment, etc.
300
What was the control in the spaghetti lab?
The control was regular spaghetti. It is the "normal" pasta. :)
300
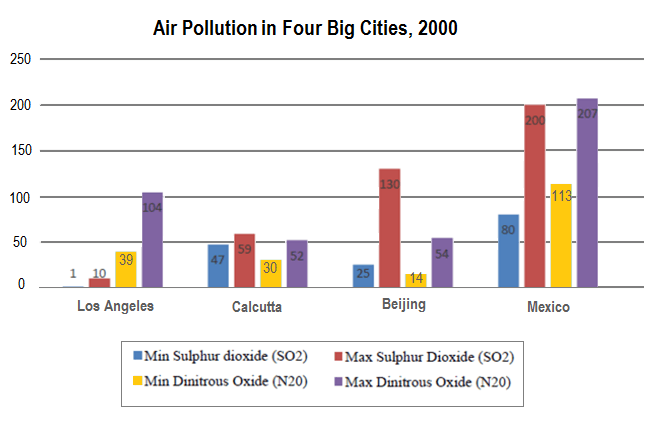
I want to compare groups. What kind of graph should I use?
You should use a bar graph.
400
What was the independent variable in the M&M's experiment?
The independent variable was the color of the M&M's.
400
What was the dependent variable in the pH lab?
The dependent variable was the pH number (0-14).
400
What was one constant in the M&M's lab?
One constant was the kind of candy. Also: the packages, the classroom, etc.
400
What is the control in this experiment below? Look closely at the top!
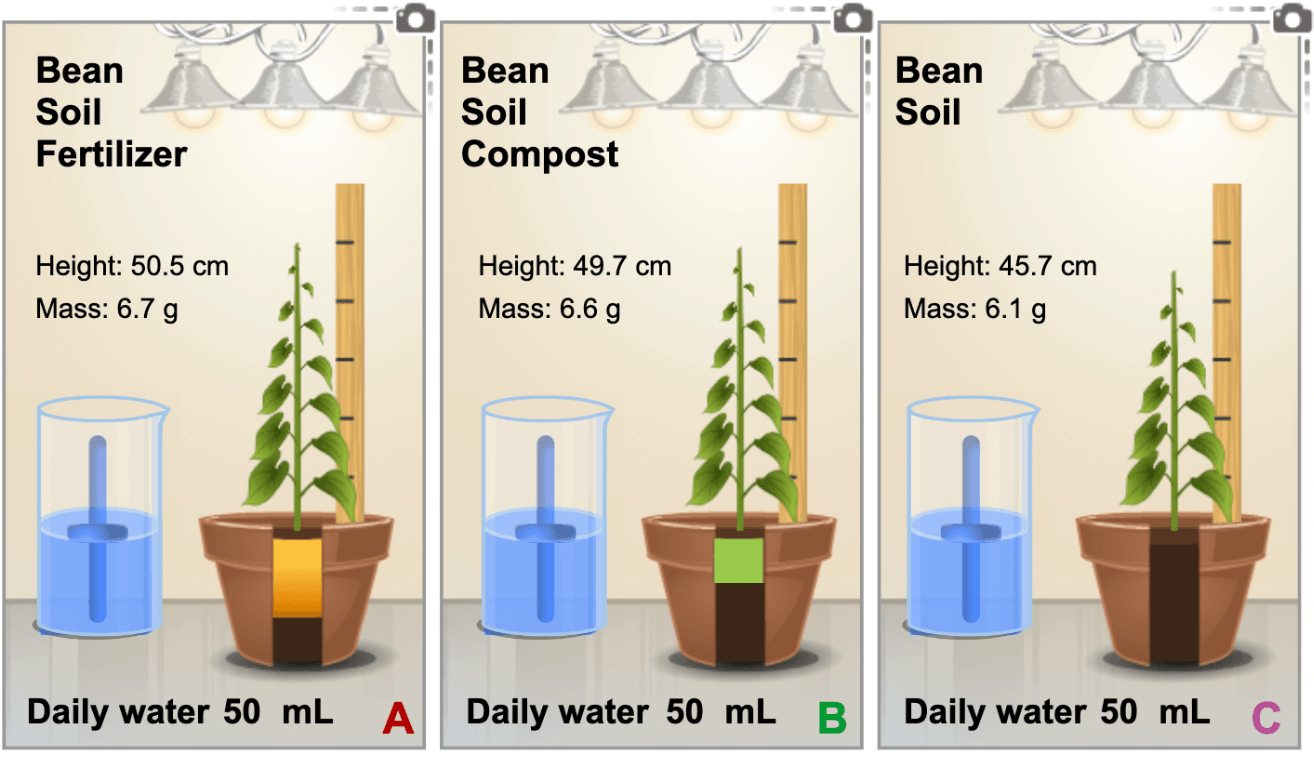
The control is the plant with no fertilizer or compost.
400
Where should I put my independent variable on my graph?
You should put the independent variable on the X axis.
500
What is the independent variable in the example below?
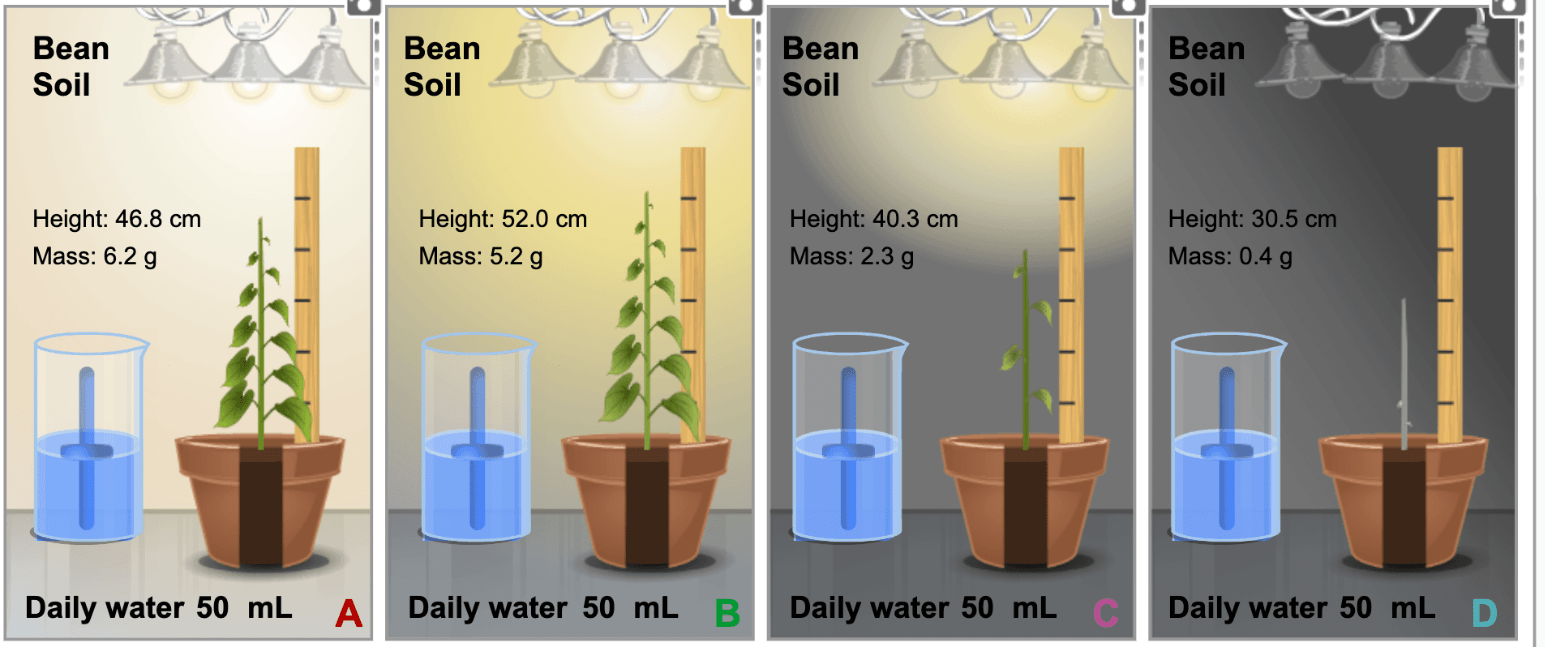
The independent variable is the number of lights turned on.
500
What is the dependent variable in the experiment below?
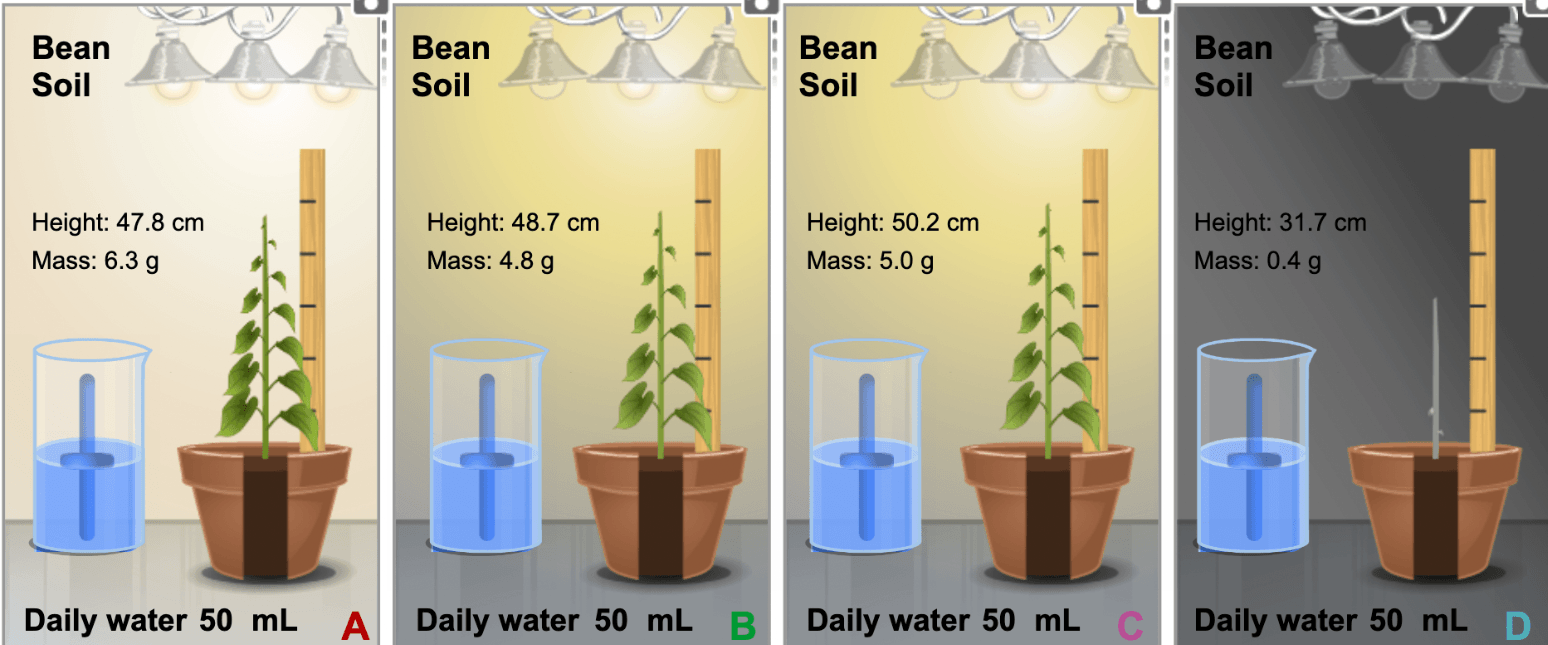
The dependent variable is how tall the plant grew, the mass of the plant, or also the color of the plant and how many leaves it has.
500
What is one constant in the experiment below?
One constant is the type of plant (bean). Also the soil, the amount of water.
500
Students predicted that listening to music helped students study better. They gave one group of students an assignment to complete without music. They gave another group of students an assignment to complete while they listened to music. What is the control?
The control is the group WITHOUT music because it is the normal situation.
500
Where should I put my dependent variable in an experiment?
The dependent variable should go on the Y axis.
