Unit 1: Functions
Unit 2: Linear Equations
Unit 3: Expressions and Transformations
Unit 4: Scatter Plots
100
In function notation, the "x" in "f(x)" is called the...
A. Variable
B. Input
C. Output
D. Solution
B
100
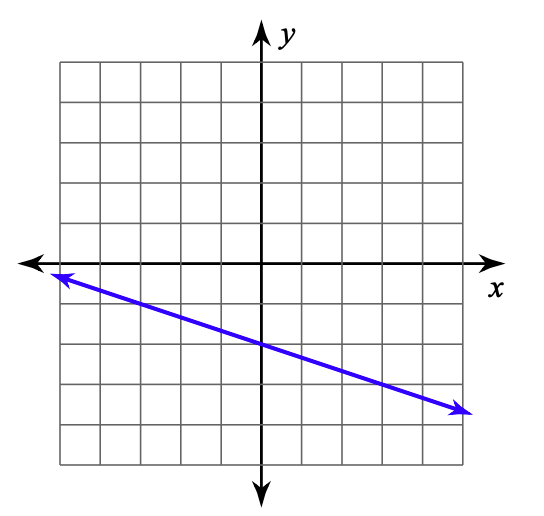
Which of the following equations matches the graph shown below?
A. y = 5x + 4
B. y = 4x + 5
C. y = 0.5x + 4
D. y = 4x + 0.5
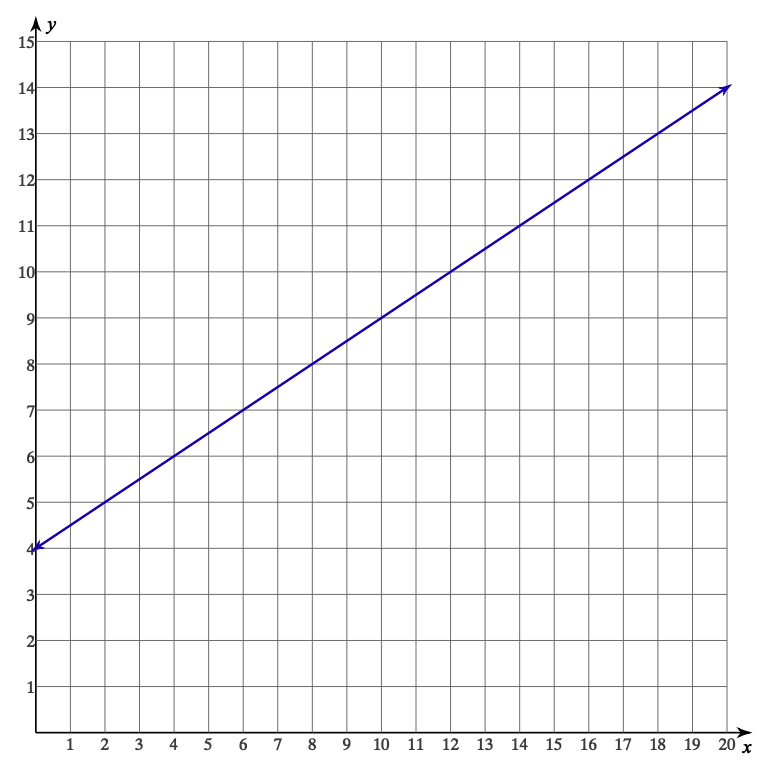
C
100
(-3p+2)(4p+1)
-12p^2+5p+2
100
Which of the following is true about the prediction made with the line of best fit for a student who worked for 4 hours?
A. The line of best fit slightly over-estimates that student's score.
B. The line of best fit vastly over-estimates that student's score.
C. The line of best fit slightly under-estimates that student's score.
D. The line of best fit perfectly predicts that student's score.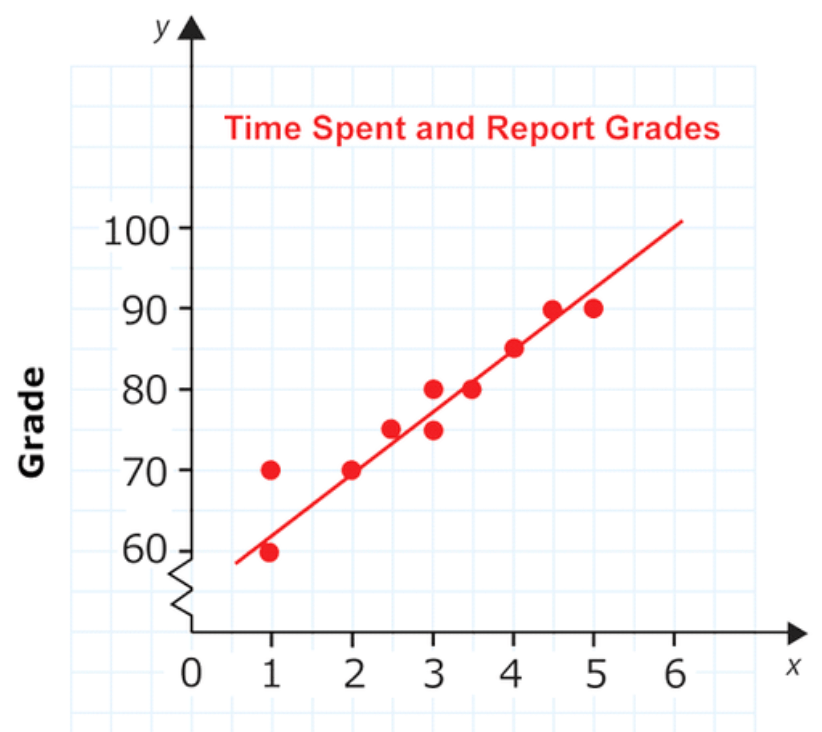
D. The line of best fit perfectly predicts that student's score.
200
Is the following table a function? (HINT: Think about a vending machine)
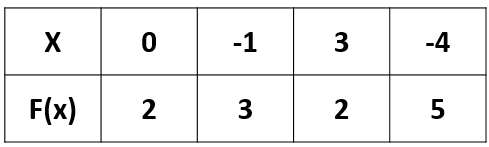
Yes
200
Ms. Magier tried to graph the linear equation
y=1/4x+3.
What mistake did she make?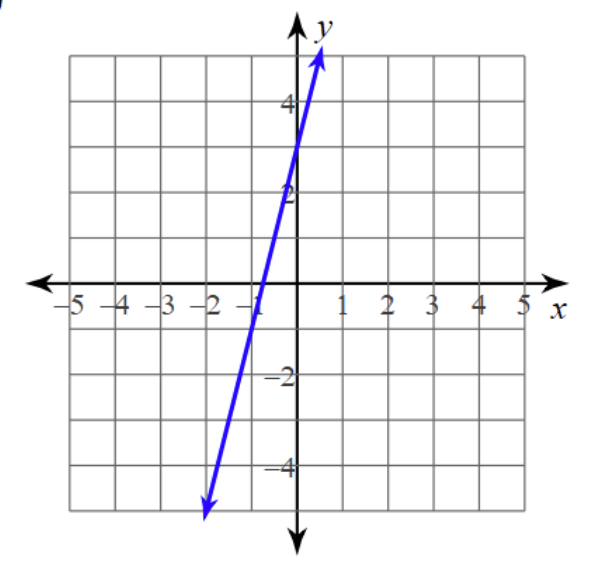
Slope of the graph is 4/1 instead of 1/4 - Ms. Magier switched rise and run.
200
(2x-5)^2
4x^2-20x+25
200
What is the line of best fit equation for the table shown below?
y = 2.49x + 1.47
(or y = 2.5x + 1.5)
300
What is x when f(x) = 4?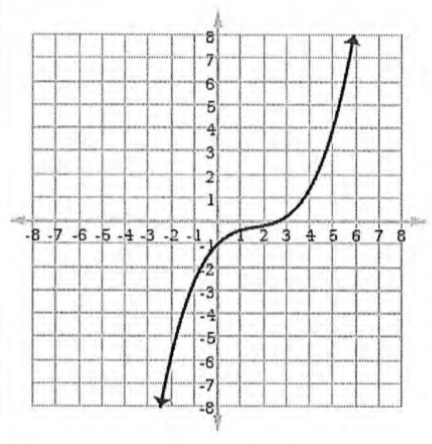
5
300
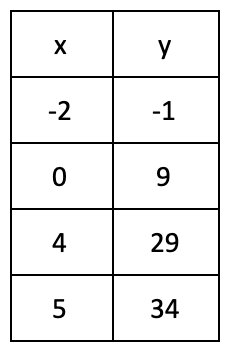
Using the table below, what is the average rate of change (slope) from x = 1 to x = 5?
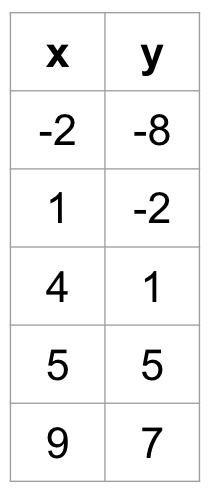
7/4
300
What is the slope of a line that is perpendicular to the graph shown?
3
300
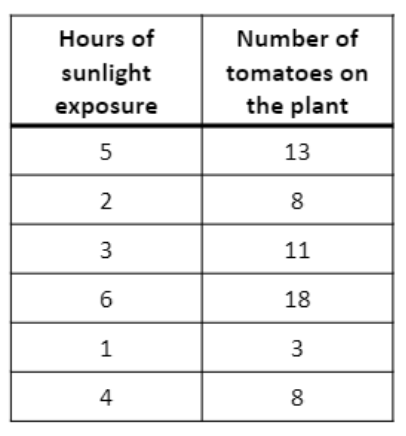
What is the correlation coefficient for the table shown below? (use ALL 6 x and y values)
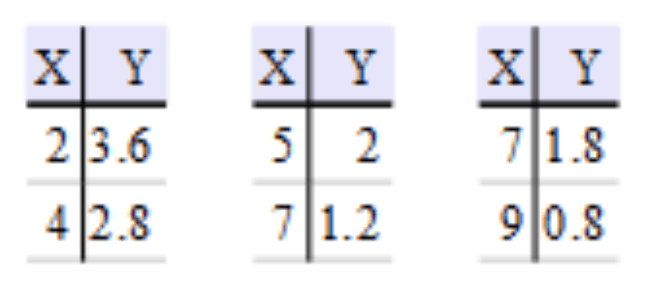
r = -.97
400
f(x)=(x^2-3x+5), evaluate f(-2)
15
400
What is the slope (m) of the table shown below?
m = 5
400
What will the new coordinates be? (x, y)
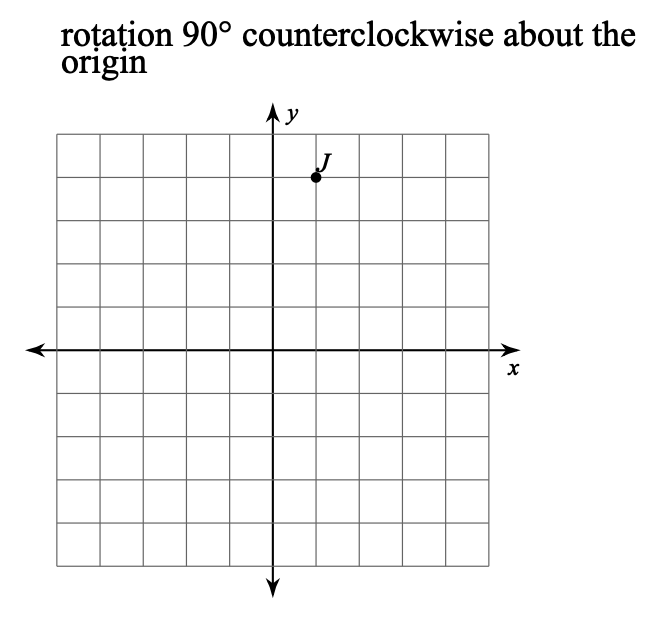
(-4, 1)
400
The equation for the line of best fit that represents the relationship between hours spent playing video games (g) and hours spent doing homework (h) in one week is:
g=-1.5h+23
If a student spent 6 hours doing homework last week, predict the number of hours they spent playing video games.
14 hours of games
500
Solve for x:
3+4(-x-8)=43+8x
x = -6
500
You fly 3,000 miles from Los Angeles to New York City. If it takes the plane 5 hours to make the trip, how fast was it flying in feet per hour? (1 mile = 5280 feet)
3,168,000 feet per hour
500
What will the new coordinates be? (x, y)
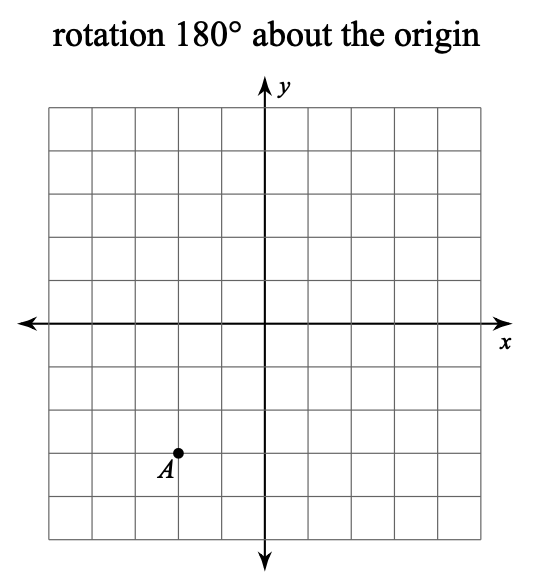
(2, 3)
500
The equation for the line of best fit that represents the relationship between hours spent playing video games (g) and hours spent doing homework (h) in one week is:
g=-1.5h+23
What does the slope represent in context of the situation?
For each additional hour spent doing homework, time spent playing video games decreases by 1.5 hours.