Scientific Method
Graphs
Variables
Potpourri
100
A prediction about what will happen with the experiment
What is a hypothesis?
100
Used when comparing different things.
What is a bar graph?
100
The two types of variables on a graph.
What is independent and dependent variables?
100
A light bulb shining is an example of this.
What is radiant energy?
200
A hypothesis must be
What is testable?
200
Used when showing change over time.
What is a line graph?
200
This variable is always on the x-axis.
What is the independent variable?
200
A change in speed or direction results in this.
What is acceleration?
300
When your data does not support your hypothesis, you do this next.
What is edit your hypothesis or create a new one?
300
The type of graph used for this data table.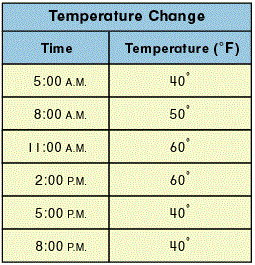
What is a line graph?
300
This variable is always on the y-axis.
What is the dependent variable?
300
Distance divided by time.
What is speed?
400
This is done after collecting and recording data.
What is a conclusion?
400
The type of graph for the following data.
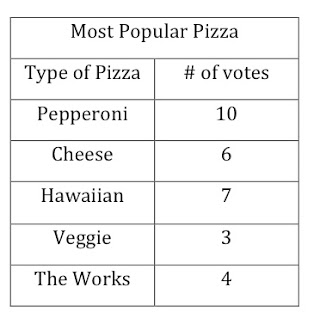
What is a bar graph?
400
This variable is the result of the experiment.
What is the dependent variable?
400
Wood, batteries, gas, propane, food, photosynthesis.
What is chemical energy?
500
During an experiment you only test one of these at a time.
What is an independent variable?
500
Graphs are used to display data because
What is visually easier to read?
500
The acronym that can help you remember what variable goes where on a graph.
What is DRY MIX?
500
If given mass when calculating potential energy use this formula.
What is GPE = mgh?