Mean
Median and Mode
Range and Histogram
Probability and Statistic Language
Statistical Question
100
What is an alternative word for Mean?
What is Average.
100
What is a Median? How do you find it?
What is A median is a middle number, You find it by lining up the numbers from least to greatest and finding the the middle number.
100
What is the definition for Range?
What is difference between the highest and lowest number. (DOES NOT HAVE TO BE WORD FOR WORD!)
100
What way is the data skewed in this bar graph?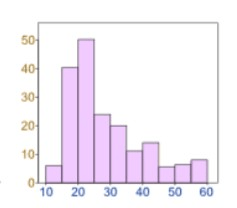
The data is skewed right. (that is where the tail is).
100
What is a Statistical Question?
What is a Question that anticipates and accounts for a variety of answers.
200
How do you find Mean?
What is You add the data together and divide by the number of pieces of data.
200
What is the Mode(s) of 65, 89, 33, 22, 66, 22, 33, 14, 88, 24,65,14?
What is 65,14,22,33.
200
What are the important parts needed in a histogram?
What is:
1) Title
2) Frequency
3) Intervals
4) Make sure the intervals touch
200
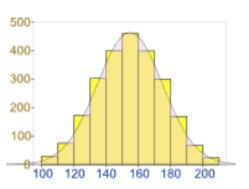 Is the data skewed left, right or symmetrical in this bar graph?
The data is symmetrical in this bar graph.
200
What 3 things do you need to have a real Statistical Question?
What is They need to have Variety,Need to be interesting, and Specific.
300
What is the Mean of 25,7,24,48,101,77,40 and two?
What is 40.5
300
Is it possible for the Median to be the same as the Mode ever?
What is yes.
300
What is the range in the data for the Fastest Steel Roller Coaster?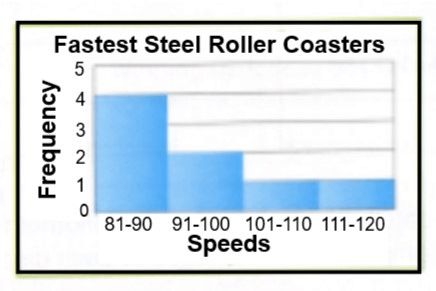
The range is 39 mph.
300
What does it mean to have a gap in your data?
If you have a gap in data, that means there is no data for certain numbers.
300
How Many people like Bananas? Is this a statistical question?
What is NO
400
What is the Mean of 3,68,98,12,56,78?
What is 52.5
400
What is the Median of 101,29,4,8,7,9,22,33,12?
What is 12
400
Why is it important to work on your Weekly Spirals and understand them?
Each of the benchmark tests have questions from your weekly spirals. If you understand the weekly spirals, you will do well on the Benchmarks.
400
You have 12 colored marbles in a bag: 2 red, 4 green, 1 purple, and 5 yellow.
What is the probability that you would select a green marble?
-use a fraction
-percentage
-and then say whether it is unlikely, likely or neither.
The probability is:
4/12 = 1/3
33%
unlikely
400
Make a statistical question for Mr. Beldue's 6th grade class.
Mr. Beldue will determine your points
500
Billy is 7 years old, his friend Sarah is 6,Ben is 8,Amanda is 10, Joe is 15,Cam is 13, Kasey is 4, and lastly George is 7. With all these people what is the mean of this data?
What is 8.75
500
Jenna has 7 green marbles,24 blue marbles, 2,737 red marbles(Jenna loves her red marbles), 33 Purple marbles, 1 pink marble and 69 yellow marbles. What is the median of the marbles?
What is 28.5
500
What two items is the following histogram missing?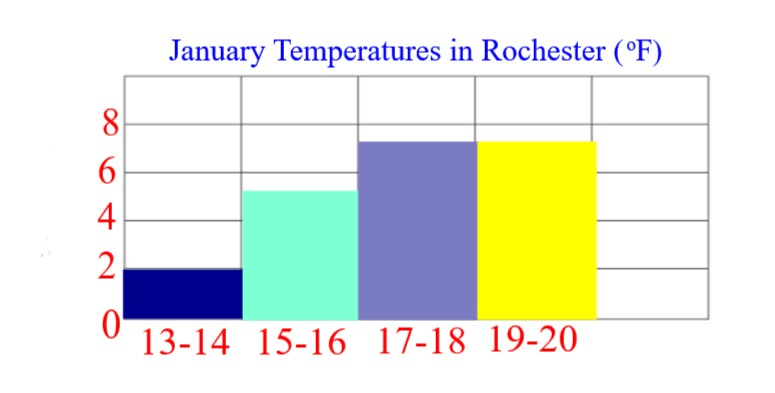
It is missing the label for frequency and the temperatures.
500
Use clusters, peaks, gaps, symmetry & outliers to describe the shape of the bar graph.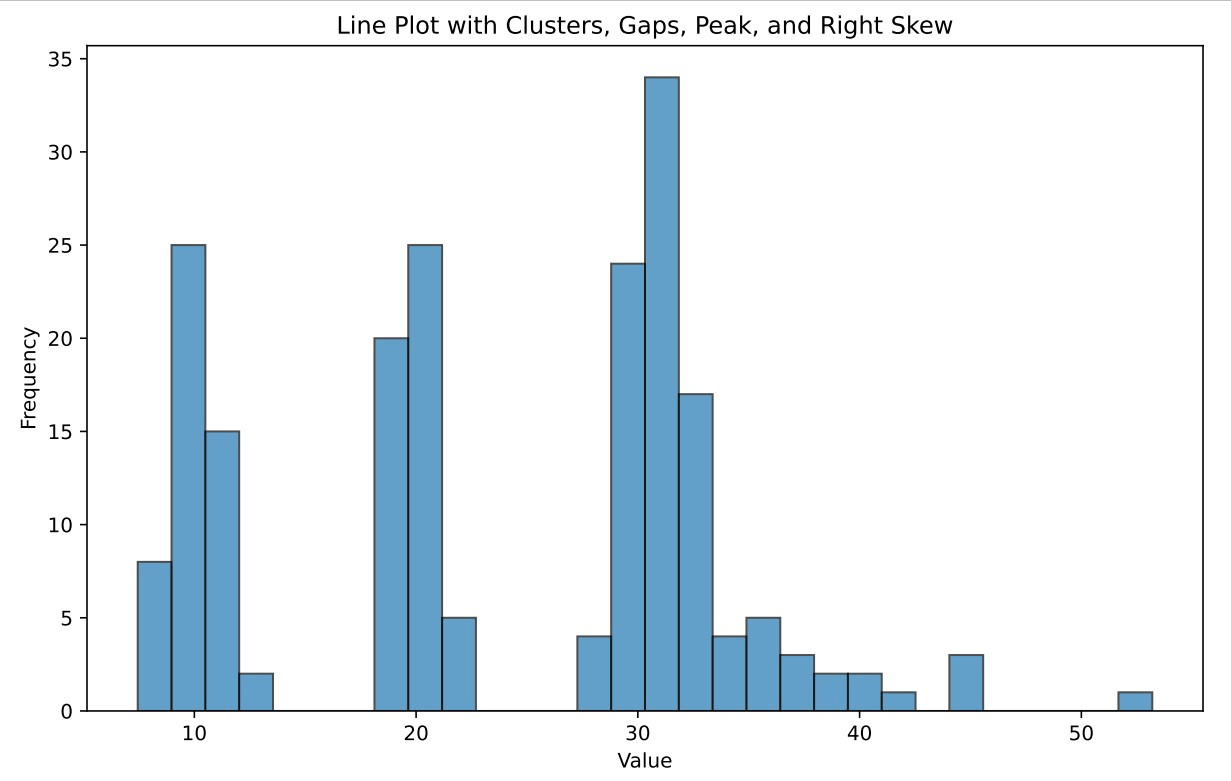
The bar graph has multiple gaps, one of them being between appx. 14-18. There is a peak in the data at 34. In addition there are multiple clusters, from 5-14 and 26-42. Lastly, there is an outlier at 52. The last cluster is skewed right.
500
If a Statistical Questions what kind of pet do you have, and 7 people said dog, 4 said cat 1 said fish 3 said hamster, Would this be a variety of answers?
What is Yes