Foundations & Data Types
Parameters vs. Statistics
Shapes of Distributions
Visualizing & Describing Distributions
Measures of Center & Spread
100
This is a characteristic or attribute that can take on different values for different individuals or objects.
What is a variable?
100
This single letter is universally used in statistics to represent the sample size.
What is
n?
100
A distribution where the left and right sides roughly mirror each other possesses this overall shape attribute. 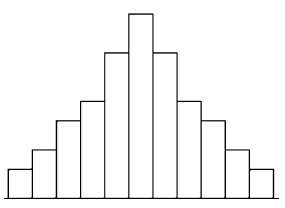
What is symmetric
100
In the mnemonic acronym CUSS (with context) used to describe distributions, the letter "S" stands for these two structural properties.
What are Shape and Spread?
100
Calculated as the Q_3 - Q_1 , this measure of variability is where 50% of the data lies.
What is the Interquartile range (IQR)?
200
What is the entire group of items or individuals of interest in a statistical study called?
What is a population?
200
A single numerical summary value calculated from a measured sample, represented by symbols like \overline{x} or s .
What is a statistic?
200
A graph displaying a single prominent peak is classified by this structural term.
What is unimodal?
200
This type of plot breaks numbers into two parts to display exact values while showing the overall shape of a quantitative dataset. 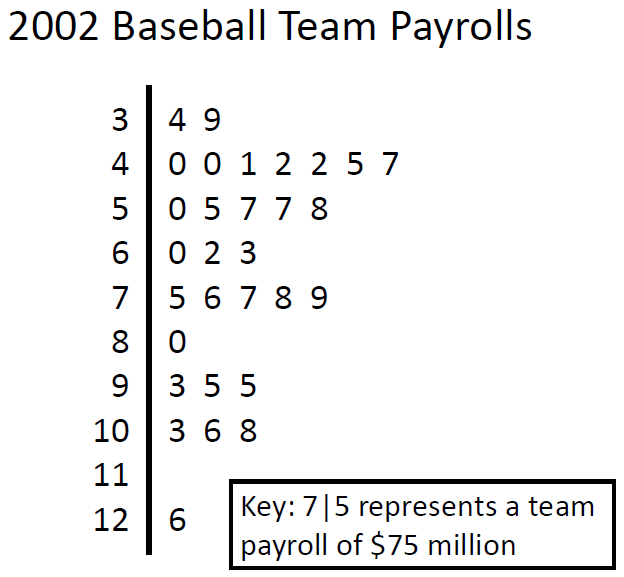
What is a stem-and-leaf plot?
200
This is the formula for calculating a z-score.
What is
(x_i -\mu)/(\sigma)
300
What term refers to an individual item or row in a data set from which information is gathered?
What is an observational unit (or individual/case)?
300
A numerical value summarizing an entire population, represented by Greek letters like \mu or \sigma.
What is a parameter?
300
When a distribution has a long tail pointing toward higher values on the right, it exhibits this shape. 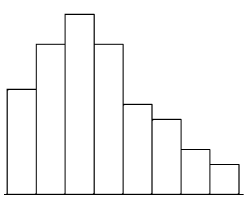
What is right-skewed (or positively skewed)?
300
Unlike a bar chart, this graph displays quantitative data grouped into contiguous intervals called "bins" or "classes". 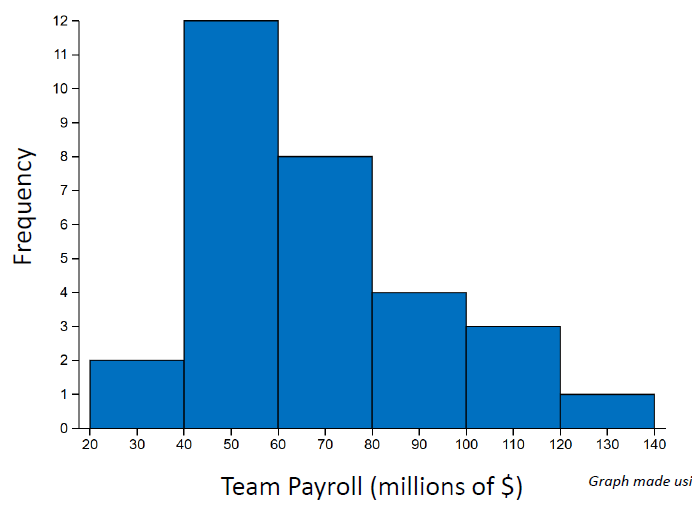
What is a histogram?
300
The exact physical middle value of an ordered dataset, denoted as Q_2 .
What is the median?
400
Zip codes and favorite sports teams fall under this variable type because their values are group labels rather than numerical quantities.
What is a categorical variable (or qualitative variable)?
400
In a sample of 3 students with heights 72.3, 64.8, and 67.2 inches, the value 68.1 represents this specific calculated statistic.
What is the sample mean (\overline{x})?
400
A distribution that shows two distinct, clear local peaks is described as having this shape.
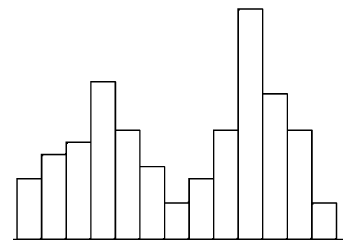
What is bimodal?
400
While histograms are great for summarizing large datasets, this primary disadvantage separates them from stemplots and dotplots.
What is the inability to see individual data values?
400
This measure of spread quantifies the typical distance that data points fall away from the mean.
What is standard deviation (s or \sigma)?
500
This subcategory of quantitative variable can take on any numerical value within an interval, such as height, weight, or time.
What is a continuous quantitative variable?
500
When a website reports that "89.3% of all 2021 graduates found jobs," that figure is considered a parameter of that graduating class rather than a statistic because of this reason.
What is because data was collected from the entire population of graduates rather than a sample?
500
A quantitative distribution where every class or bin has approximately the same frequency, appearing flat across the top, has this shape.
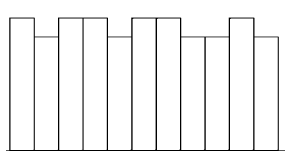
What is uniform?
500
When describing data distributions on the AP exam, students must always link their structural findings to this real-world element.
What is context (units/variable names)?
500
Defined as the square of the standard deviation ( s^2 ), this measure of spread has squared units that make direct interpretation tricky.
What is variance?
600
This subcategory of quantitative variable can only take on distinct, countable values with gaps in between, such as shoe sizes or number of pets.
What is a discrete quantitative variable?
600
The capital letter N represents the size of this group, whereas the lowercase letter n represents the size of this subgroup. (two answers)
What are the population size ( N ) and sample size ( n )?
600
When a distribution's longer tail extends far to the left toward lower values, it is described as having this specific shape.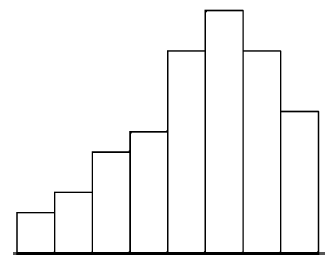
What is left-skewed?
600
When a dataset contains extreme outliers or strong skewness, these two summary statistics are preferred over the mean and standard deviation because they are resistant to extreme values. (two answers)
What are the median and interquartile range (or IQR)?
600
In this classic rule for identifying outliers, a observation is flagged as an outlier if it falls more than 1.5 times the Interquartile Range above this quartile or below this quartile.
What is Q_3 and Q_1?