Finding m & b
Writing Equations
Graphing Equations
Miscellaneous
100
State the slope and y-intercept from the equation. Also give the ordered pair of the y-intercept.
y = 5x + 8
m = 5
b: 8 and (0 , 8)
100
Write the equation in slope-intercept form of the graph below:
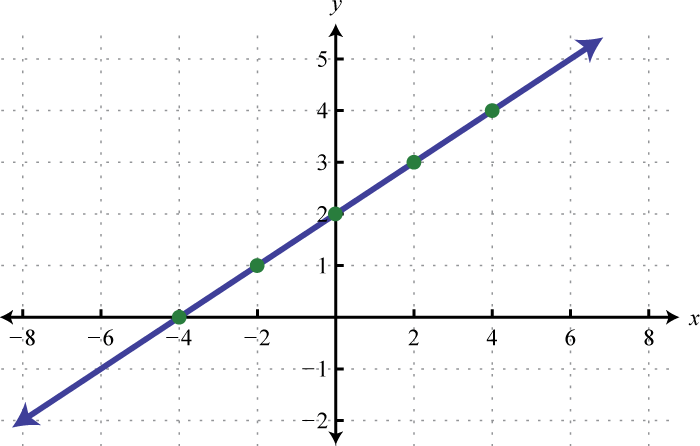
y = 1/2x + 2
100
Graph y = 3x. State what kind of relationship the graph shows.
Graph is proportional and linear.
100
State whether each equation is proportional or nonproportional:
A: y = 3/5x B: y = x - 5 C: 3 - 4x D: y = -5x
A: proportional B: nonproportional C: nonproportional D: proportional
200
State the slope and y-intercept from the graph. Then state if the graph is proportional or nonproportional.

Slope = 2
Y-intercept = -1
200
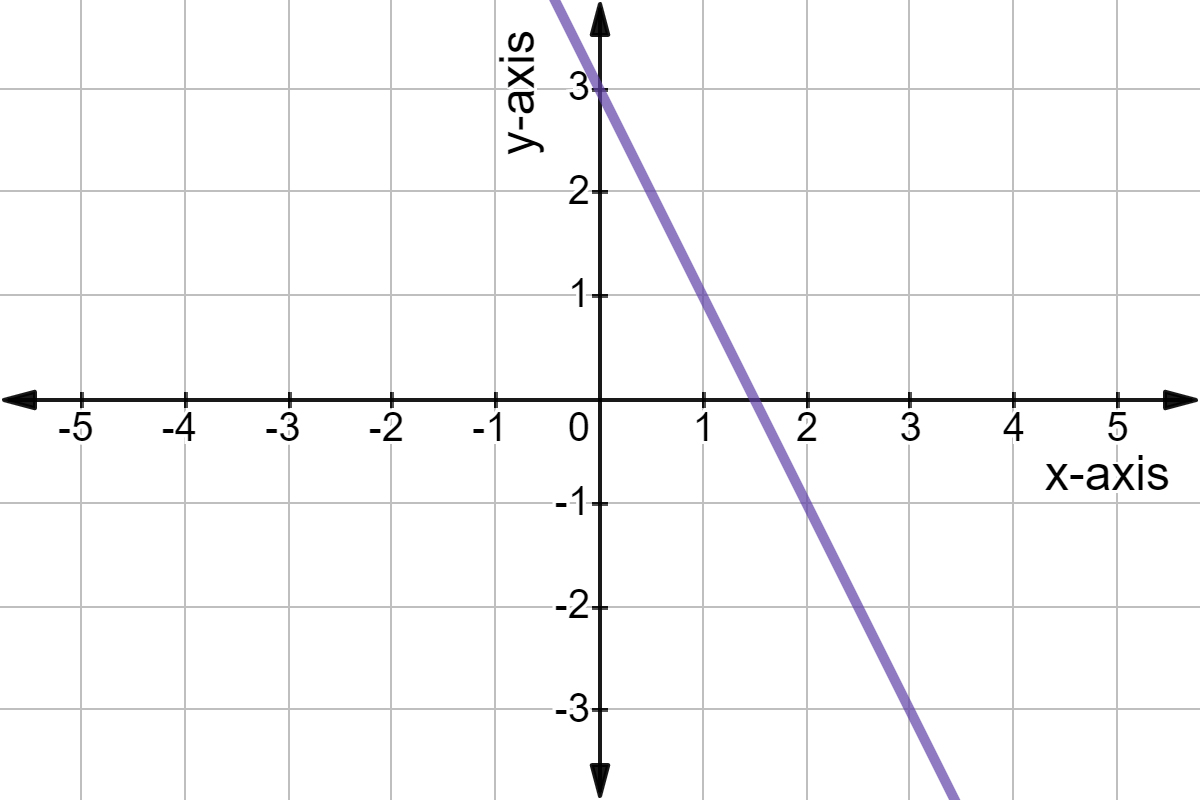 Write the equation in slope-intercept form of the graph below:
y = -2x + 3
200
Graph y = 2x + 1. State what kind of relationship the graph shows.
Graph is nonproportional and linear.
200
Which statements are true about the graph. Select all that apply:
A. Both are linear B. Both are proportional C. Both have increasing slope. D. Neither are proportional E. Green is nonproportional

A, C, E
300
Find the slope and y-intercept of the equation y = 2x - 5
Also give the ordered pair of the y-intercept.
m = 2
b = -5 and (0, -5)
300
Write the equation in slope-intercept form of the graph below:

y = 1x - 6 or y = x - 6
300
Graph y = -2x. State what kind of relationship the graph shows.
Graph is proportional and linear.
300
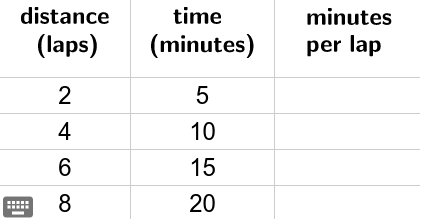
The table shows a proportional relationship. Which ordered pair could also belong to this relationship?
A. (5, 8) B. (-3, -9) C. (24, 72) D. (18,2)
C
400
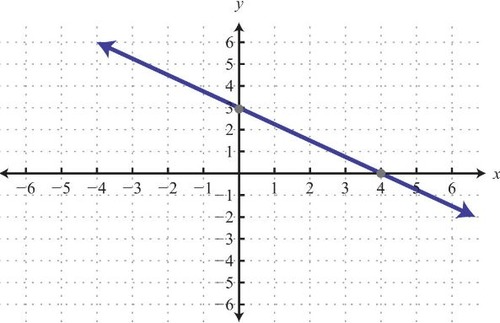
State the slope and y-intercept of the graph.

m = -4/5
b = 3 or (0, 3)
400
Write the equation in slope-intercept form of the graph below:
y = -3/4x +3
400
Graph y = 4x - 2. State what kind of relationship the graph shows.
Graph is nonproportional and linear.
400
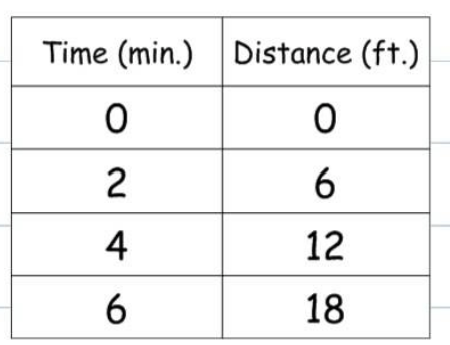
Write the equation for the table below:
x: 3, 5, 12
y: 5, 11, 32
y = 3x - 4
500
Identify the slope and y-intercept of the equation. Also give the ordered pair of the y-intercept.
y = 10 - x
slope = -1
y-intercept = 10 and (0, 10)
500
Write the equation in slope-intercept form of the graph below:

y = -4/5x + 3
500
Graph y = 5/3x - 3. State what kind of relationship the graph shows.
Graph is nonproportional and linear.
500
The table shows a proportional relationship. Which ordered pair could also belong to this relationship?
A. (-8, 20) B. (10, 25 ) C. (-1, 3) D. (16, 40)
D
600
Identify the slope and y-intercept:
slope = 2
y-intercept = 20 or (0, 20)
600
Write the equation for the graph:
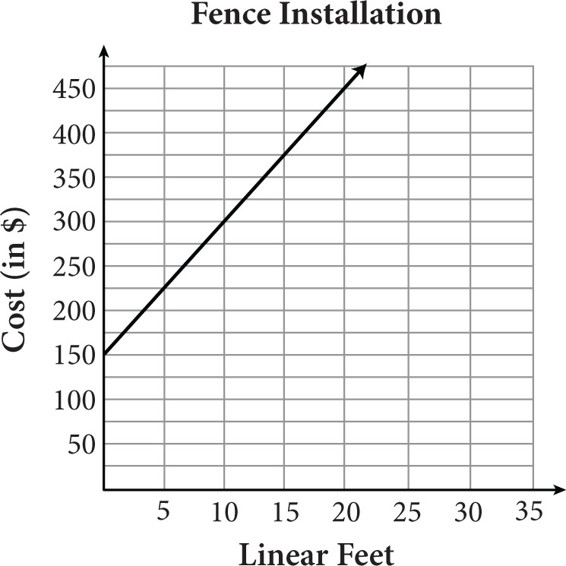
y = 15x + 150
600
Graph y = -2/3x - 4. State what kind of relationship the graph shows.
Graph is nonproportional and linear.
600
Draw and label the following:
A: linear, nonproportional line with negative slope and positive y-intercept
B: nonproportional, nonlinear line
C: proportional line with positive slope