Displaying Data
Measures of Center and Spread
Normal Distribution
Correlation
100
What kind of data (categorical or quantitative) can be displayed through a bar graph or pie chart?
Categorical
100
Which measure of center is most sensitive to outliers?
The mean.
100
Define z score.
How many standard deviations a data value is away from the mean.
100
Name the direction of correlation. 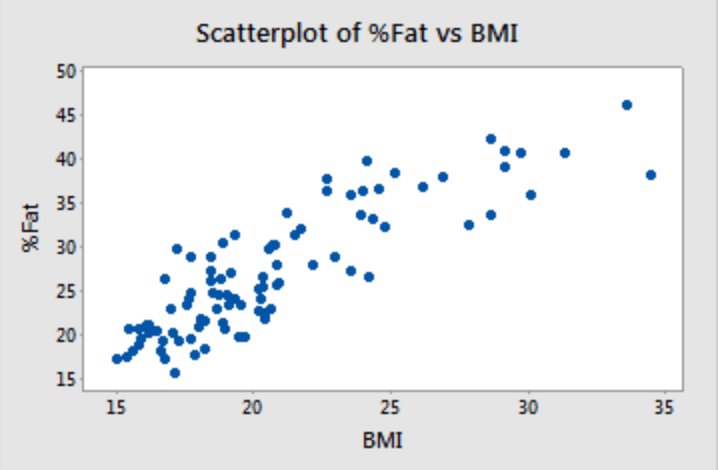
Positive
200
Identify the shape of the distribution. 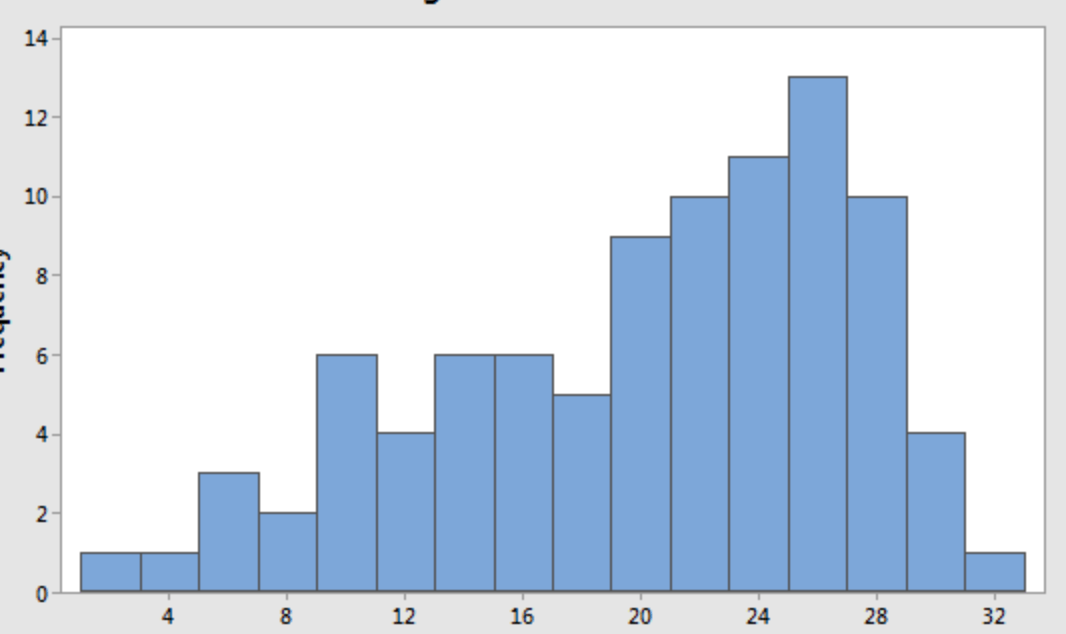
Left skew
200
Which are better measures for this distribution: mean and standard deviation or median and IQR? 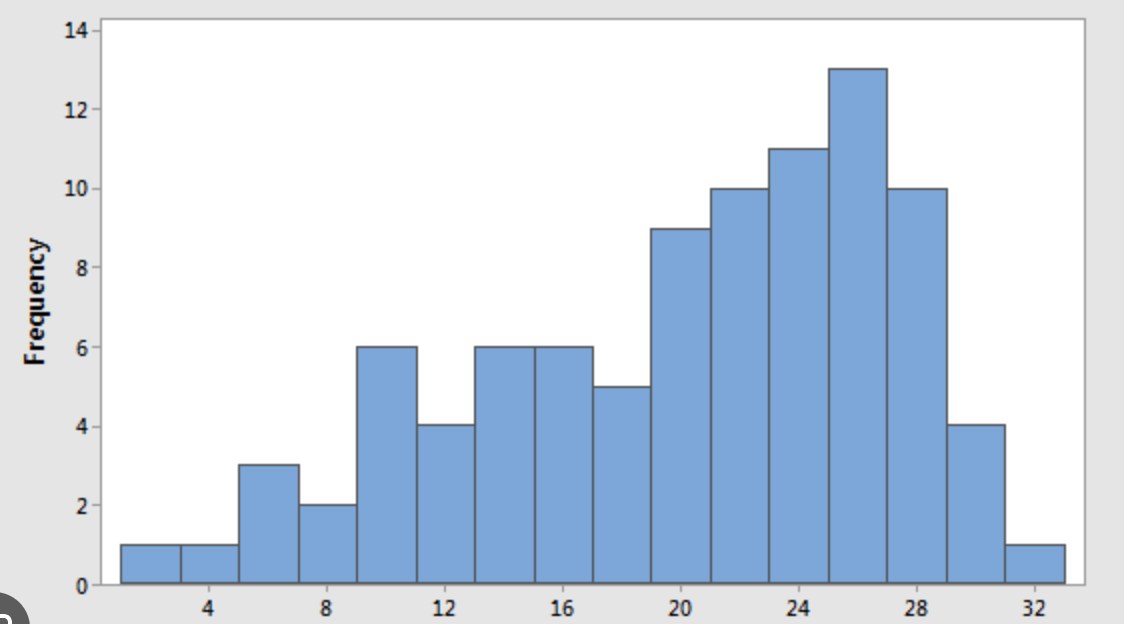
Median and IQR because the data is skewed
200
The upper arm length of males over 20 years old in the United States is approximately Normal with mean 39.1 centimeters (cm) and standard deviation 5.0 cm. 95% of the data lies between ____cm and _____cm.
29.1 and 49.1
200
Interpret the strength and direction of the correlation coefficient.
r=-0.82
Strong negative correlation
300
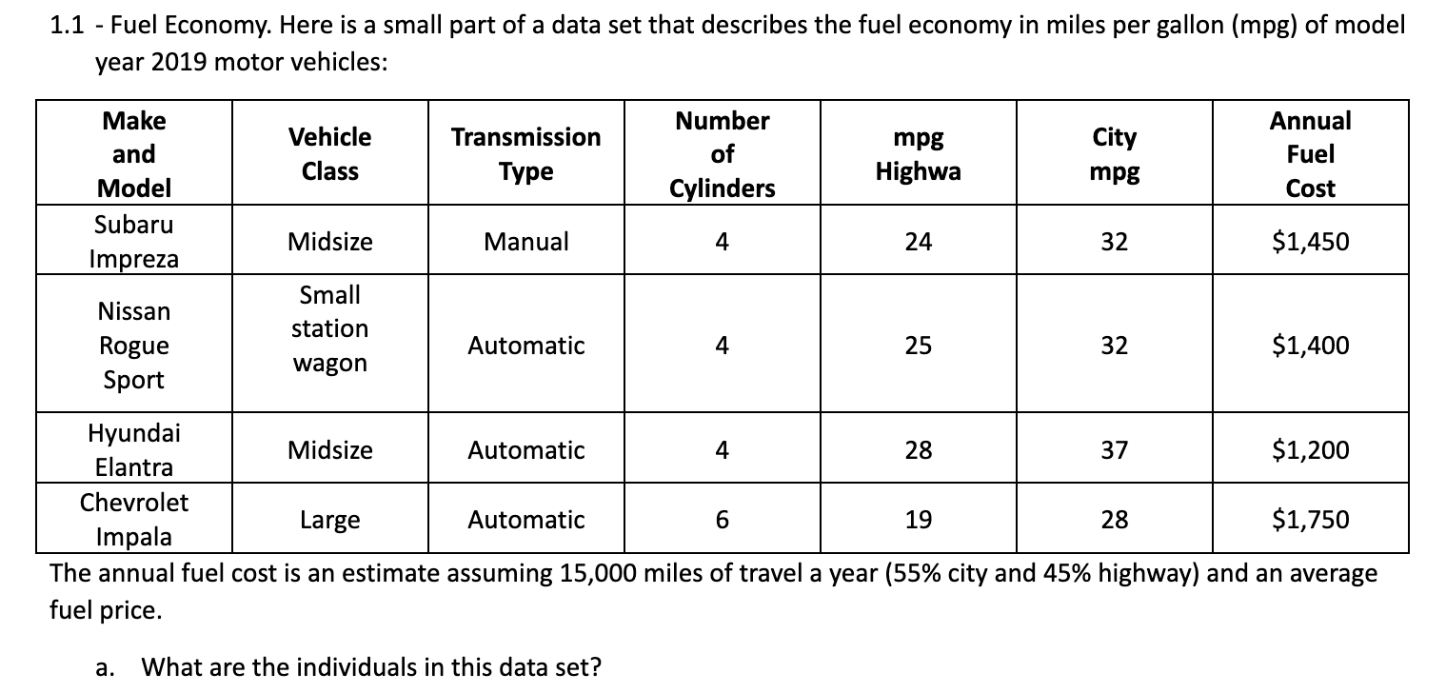
Each car
300
Find the mean, median, mode, and range. 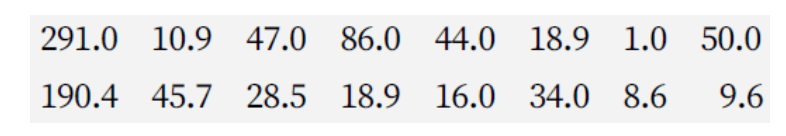
Mean: 56.28
Median: 31.25
Mode: 18.9
Range: 290
300
Almost all medical schools in the United States require students to take the Medical College Admission Test (MCAT). The total score of the four sections on the test ranges from 472 to 528. In spring of 2019, the mean score was 500.9, with a standard deviation of 10.6. What proportion of students taking the MCAT had a score over 510?
19.5%
300
Interpret r in context of the problem.
The amount of sleep you get the night before a test and your test score is found to have r=0.58.
There is a moderate positive correlation between amount of sleep the night before a test and test score.
This means that as amount of sleep increases, test scores increase (moderately speaking).
400
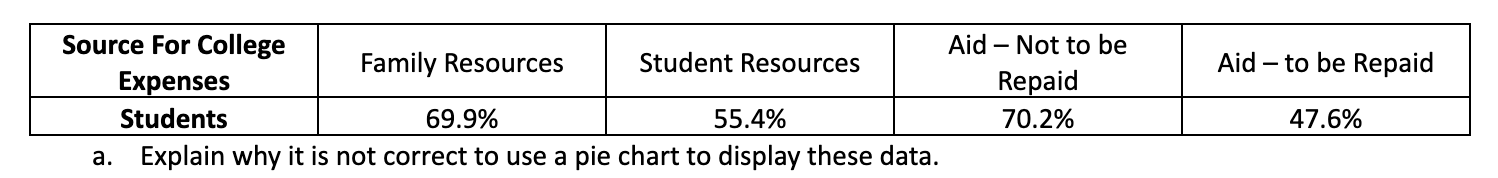
The percentages do not add to 100%, which means there are overlapping categories (individuals fit into more than one category)
400
Find P(x>2)
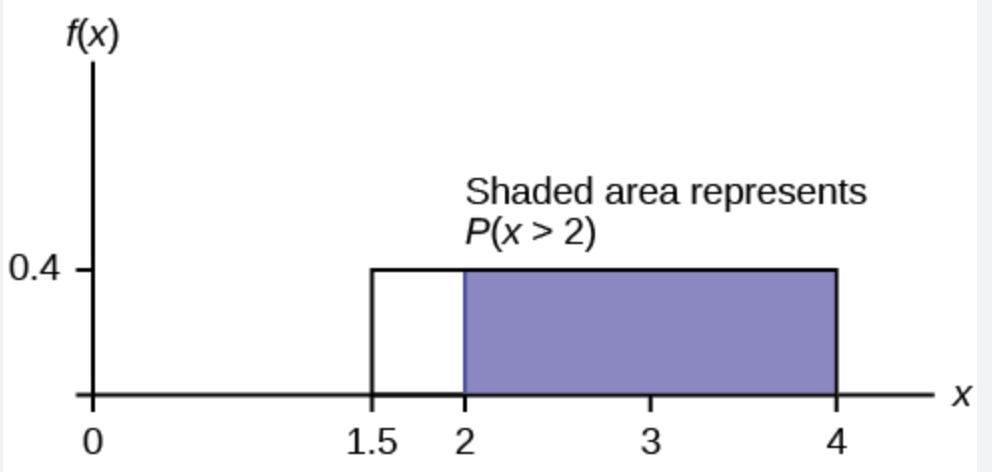
0.8
400
Almost all medical schools in the United States require students to take the Medical College Admission Test (MCAT). The total score of the four sections on the test ranges from 472 to 528. In spring of 2019, the mean score was 500.9, with a standard deviation of 10.6. What proportion had scores between 505 and 515?
25.6%
400
Match each value of r to its scatterplot.
-0.715, 0.715, 1, -0.993, 0.35
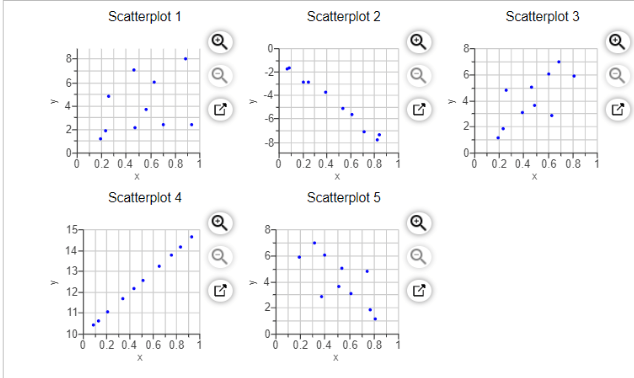
Scatterplot 1: 0.35
Scatterplot 2: -0.993
Scatterplot 3: 0.715
Scatterplot 4: 1
Scatterplot 5: -0.715
500
Determine the upper and lower fence for outliers for the following box plot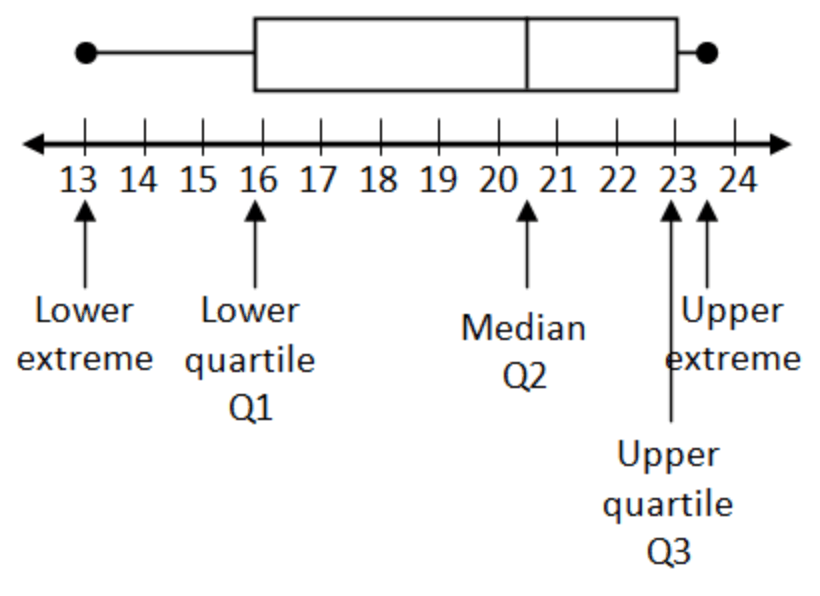
Lower fence: 5.5
Upper fence: 33.5
500
Calculate the standard deviation by hand for the following data points: 18, 31, 25
6.51
500
The combined city and highway gas mileage of vehicles is approximately Normal with mean 22.8 miles per gallon (mpg) and standard deviation 4.8 mpg. How high must a 2019 vehicleʼs gas mileage be to fall in the top 15% of all vehicles?
27.79 mpg
500
To which Hogwarts house does Ms. Lambert belong?
Slytherin