Correlation Coefficient
Describe the Correlation
Box Plot
Scatter Plot
Linear Regression
100
What's a stronger correlation coefficient,
0.78 or -0.85?
-0.85 (it's closer to -1 than 0.78 is to 1)
100
coffee drank and hours awake
Positive relationship
100
What five numbers do we need to find in order to construct a box plot?
The 5 number summary: minimum, Q1, Median, Q3 and maximum.
100
True or False: A scatter plot uses bivariate data.
True.
100
Find the linear regression equation of the following data:
(1, 2), (3, 7), (4, 5), (4, 7).
Round all values to the nearest tenth.
y = 1.3 x + 1.3
200
What letter represents the correlation coefficient?
r
200
true or false: The correlation of a scatter plot that is perfectly lined up is 2.
False.
200
The value of the third quartile.
11
200
1 set of data is called
univariate data
200
Determine whether the following statement is true.
Given the linear regression for a set of data is y = -1x +5, then we can conclude that correlation coefficient for that data set must be negative.
True.
Extra 200 points for explanation.
300
What is the range of correlation coefficient?
[-1, 1]
300
shoe size and GPA
No correlation
300
The IQR of this box plot.
7
300
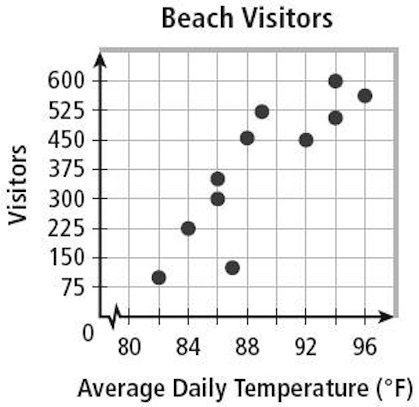 The association this graph has.
strong (or moderate) Positive
300
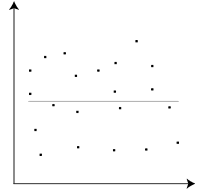
What is the correlation of the above scatter plot?
r = 0.
400
Find the correlation coefficient of these points.
(1, 4) (5, 7) (10, 14) (13, 23)
Round to the hundredth
.97
400
amount of hours spent watching TV and your electric bill
Positive (weak)
400
The percent of values less than 4.
25%
400
 The statement that best describes this graph.
A. As temperature decreases, sales go up
B. As temperature increases, sales go up
C. As temperature decreases, sales go down
D. As temperature increases, sales go down.
B
400
What is the possible linear regression for the above scatter plot?
a) y = 2x +1
b) y = 2
c) x = 2
b)
500
Describe the correlation of the following points
(-1, 4) (-5, -9) (-4, 10) (-3,-5)
Weak positive
500
the amount of time you go shopping vs the amount of money you have
Negative
500
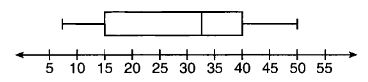 Find the interval that contains exactly 50% of the ages.
7-15 15-33 33-40 15-40
15-40
500
an r-value of 0.893 is called ...
strong positive
500
Find the linear regression about the following data:
(1, 2), (2, 3), (4, 5), (7, 8).
And what is the correlation coefficient of the data? What does that correlation coefficient imply?
Linear Regression: y = x +1
Correlation Coefficient: r =1
That correlation coefficient implies that there is a positive relationship between two variables. And the strength of two variables is perfect which means the dots on their scatter plot graph on a perfect straight line.