On a pictograph what is used to represent each data piece?
picture
How do you show the data pieces in a line plot?
place an x or a dot over the value on a number line
What is different about the shape of a circle graph?
the shape is a circle
What is used on a bar graph to show the number of data pieces for each category?
bars
How are the data pieces shown on a line graph?
as points that are connected in a "line"
You have to include this with a pictograph to show what each picture represents.
key
When is a line plot the best display to use?
to show trends and how data varies
When is a circle graph the best display to use?
to show parts of a whole like percent
When is a bar graph the best display to use?
when comparing amounts or categories
When is a line graph the best display to use?
to show a change in values over a time period
How many hours was Bob sleeping for on Saturday?

10 hours
What is the name of a value on a line plot that is isolated and far away from the other values?
an outlier
How are categories usually shown on a circle graph?
each category is a different color shown as a fraction or percent
Which bar represents the mode on a bar graph?
the tallest bar
How can you find range on a line graph?
Subtract the lowest value from the highest value.
How many more children ride the bus than walk to school?

4 more children
On which day were the most cars sold?

Friday
The final exam is 50% of this class grade.
What makes up the other 50%?

quizzes, projects, and participation
What is a good way to show the different categories that are being compared on a bar graph?
make each bar a different color
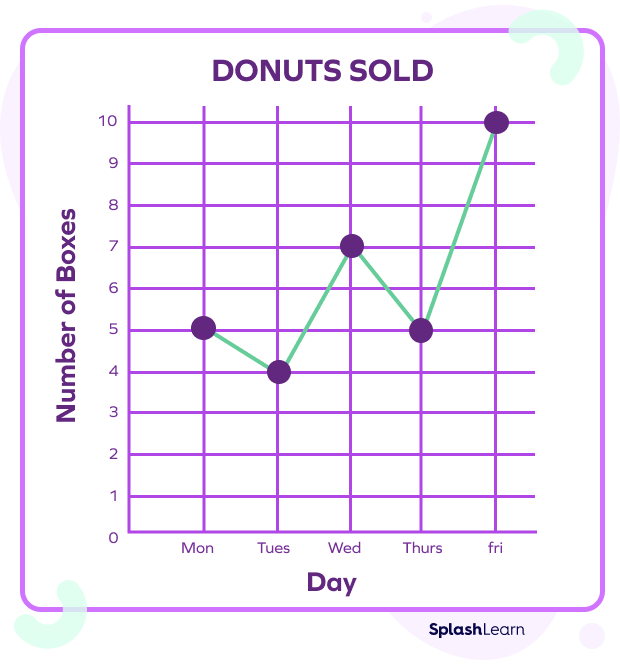
Which two days sold the same number of boxes of donuts?

Monday and Thursday
Sam is making a pictograph. He is going to draw squares to represent 10 cards each on the graph. He realized that he has 25 Mets cards. What should he do to represent the 5 cards?
He should only draw 1/2 of a box to represent the 5 cards.
What is the range of minutes to eat breakfast?
12 minutes
What percent of people surveyed chose peaches?
25%
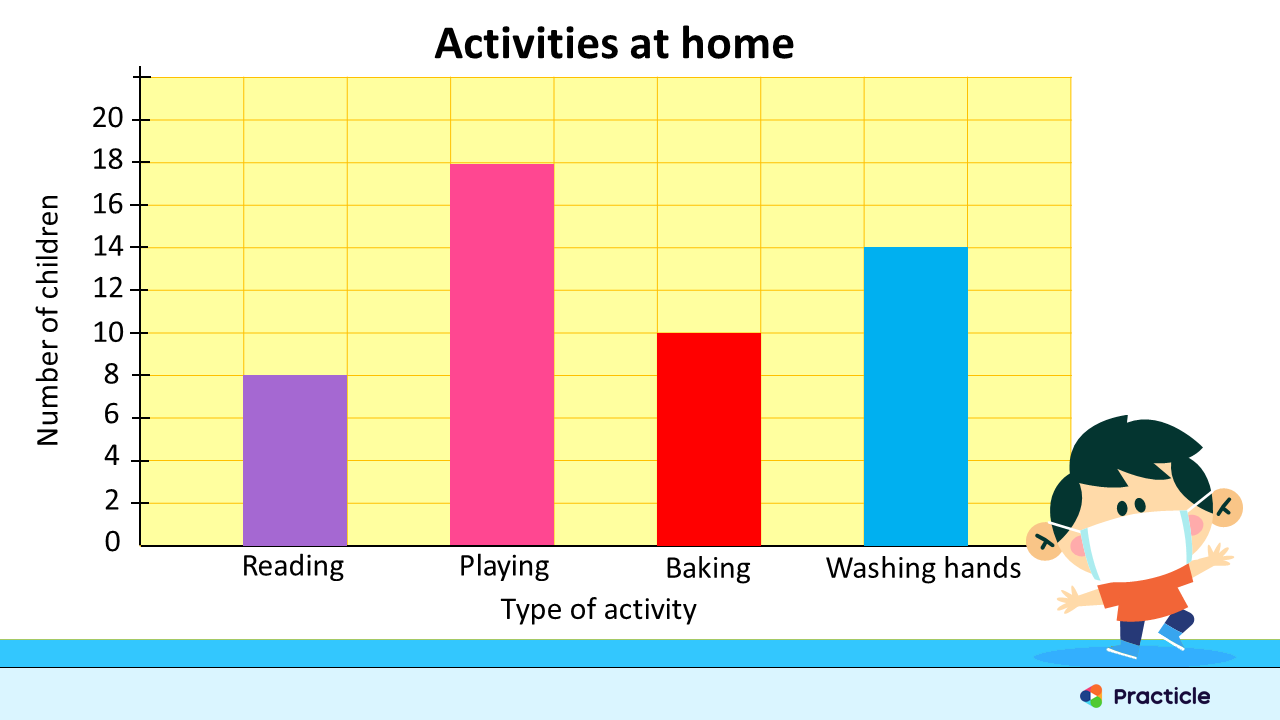
How many children chose reading as their favorite home activity?

8 children
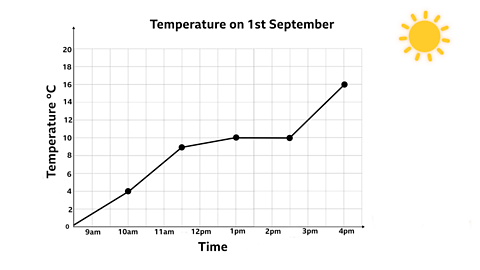
Between what two times did the temperature increase the most?

2:30 and 4:00 pm
