Individuals & Variables
Name that Diagram
Center & Variability
Dot Plots & Histograms
Box Plots & Outliers
100
The number of individuals in this data set.
What is five (5)?
100
The image below is an example of this type of chart.
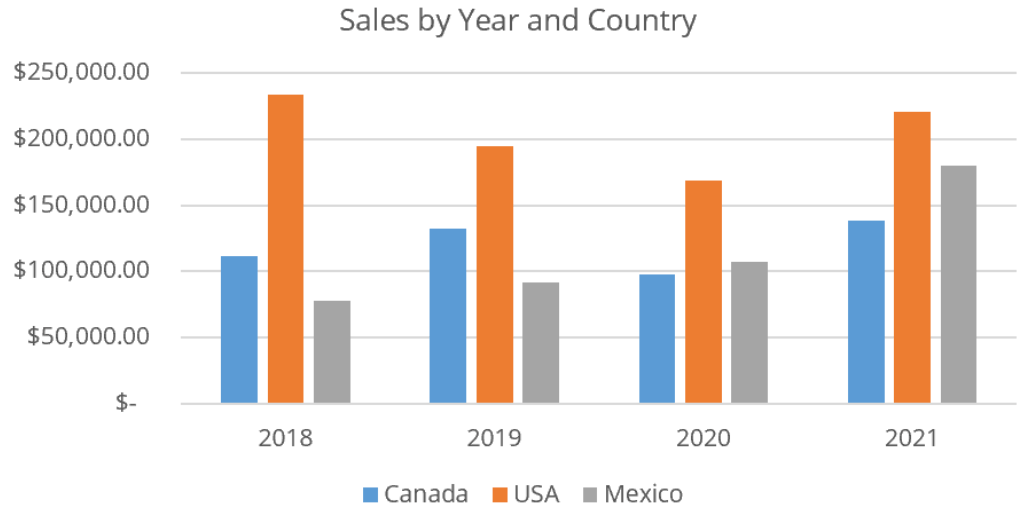
What is a bar chart (or bar graph)?
100
The range of this data set.
12; 12; 14; 15; 10; 16; 12; 18
What is 8?
100
The minimum of the following data.
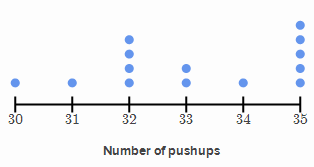
What is 30?
100
The first quartile (Q1) of the data shown in the box plot.
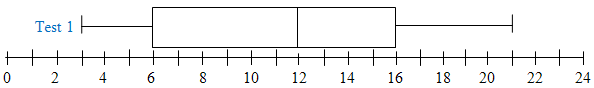
What is 6?
200
This type of variable cannot be measured, such as area code or favorite drink.
What is categorical?
200
The image below is an example of this type of plot.
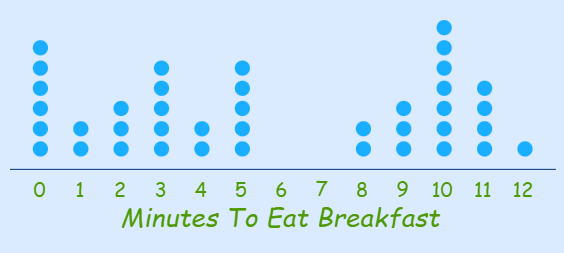
What is a dot plot?
200
The median of this data set.
7; 12; 9; 14; 14; 10; 18
What is 12?
200
The median of the following data.
What is 33?
200
The IQR of the data shown in the box plot.
What is 10?
300
Number of pets is an example of this type of variable.
What is quantitative?
300
This type of chart is often used to display relative frequencies (percents) of one categorical variable.
What is a pie chart?
300
The mean of this data set.
4; 5; 6; 5; 4
What is 4.8?
300
The shape of the data shown below.

What is symmetric?
300
Based on the box plot, a newly-added low outlier must be below this amount.
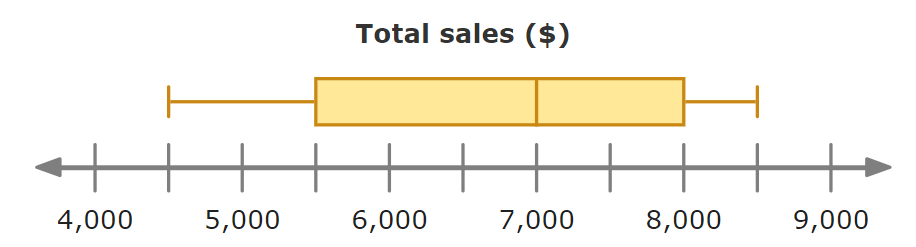
What is $4500?
400
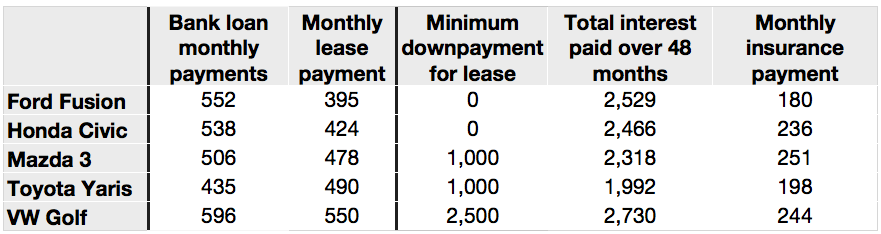
The table below has this number of quantitative and categorical variables. (count them separately)
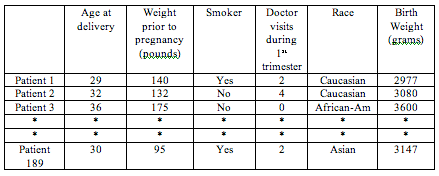
What are four (4) quantitative and two (2) categorical variables?
400
This type of plot is often used to display certain intervals of one quantitative variable.
What is a histogram?
400
The IQR of this ordered data set.
29; 34; 39; 43; 73; 91; 198
What is 57?
400
This salary range contains more than 500 employees in the histogram below.

What is 44-54 (or $44,000 - $54,000)?
400
This company's box plot has the highest measure of center.

What is company C?
500
In the table below, there are this many categorical variables.
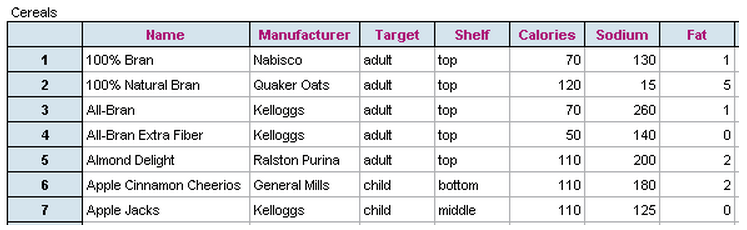
What are three?
500
This type of plot displays quartiles (medians) of quantitative data and clearly identifies outliers.
What is a box (and whisker) plot?
500
The standard deviation of this data set:
1; 1; 1; 1; 1; 1; 1; 1
What is zero (0)?
500
The shape of this dot plot.
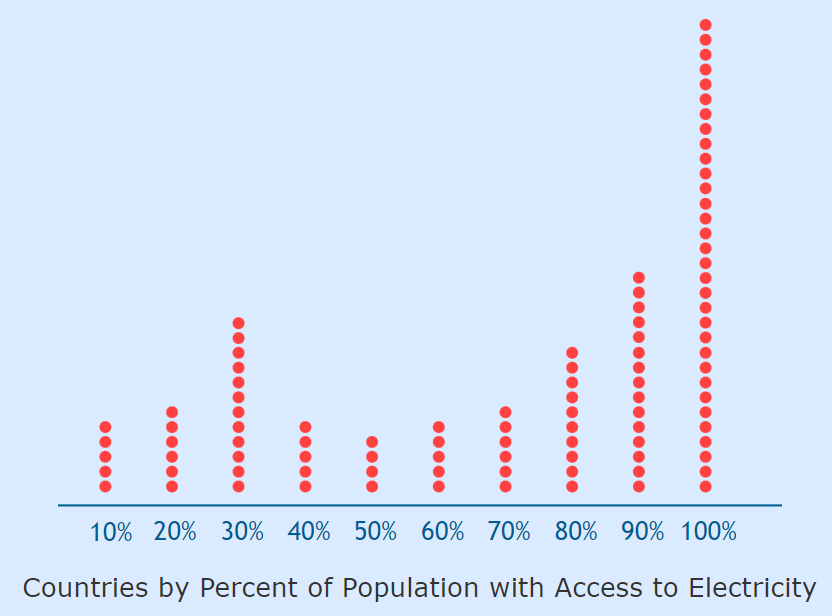
What is left skew(ed)?
500
This company's box plot has the greatest variability.
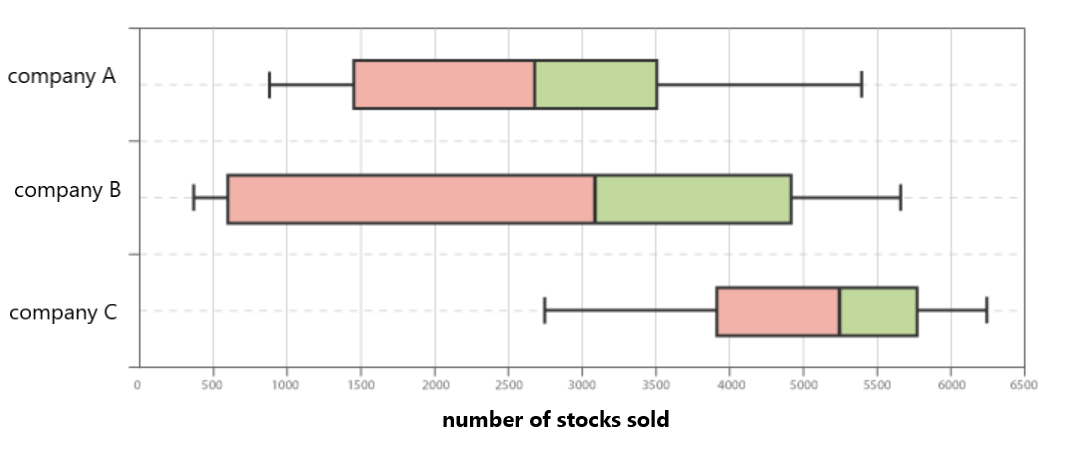
What is company B?