Vocabulary
Measures of the Center
Box Plots
Comparing Box Plots
Mixed Review/For Fun
100
Define Continuous Data
Data that can take any value in a given range
100
Find the median for the following set of numbers:
2, 4, 4, 6, 8, 10, 12
6
100
What number represents the median based on the box plot below?
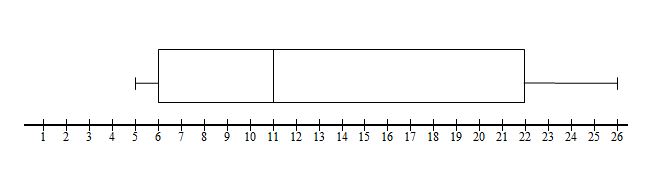
11
100
Which team has a larger range?

Team A
100
Each part of a box plot represents ______% of the data.
25
200
Define Discrete Data
Data that can only take specific, measurable values within a range
200
Find the mode for the following data set:
1, 3, 6, 8, 4, 4, 7, 1, 7, 7
7
200
What is the min for the box plot below?
5
200
Which team has a larger median?
Team B
200
There are _____ equal parts of a box plot.
4
300
Define Categorical Data
Data that can be grouped into categories
300
Find the range for the following data set:
8, 3, 2, 1, 1, 5, 18, 10, 2, 4, 3
17
300
What is the range for the box plot listed below?
21
300
True or false: The interquartile range for Team A and Team B are equal.
True
300
Which house is Blue at LDSHS?
Cunningham
400
_______________ deals with collecting, organizing, and interpreting data.
Statistics
400
What is the mean for the data set below.
1, 6, 12, 11, 3, 8, 4, 3, 6
6
400
What is the interquartile range of the box plot below?
16
400
Which team reflects 75% of the data above 45?
Team A
400
True or False: The interquartile range of a box plot represents the middle 50% of data.
True
500
A _____________ displays the five-number summary of a set of data.
box plot
500
What number represents quartile 1 for the following data set:
1, 4, 5, 6, 9, 10, 11
4
500
Below is a box plot based on points scored in the last game. What percentage of the team scored above 6?
75%
500
On average, which team scored better.
Team B.
500
Our behaviour expectations matrix is based around...
Safe, Respect, Learn