Normal Distribution
Mean/Median/Mode/Range
Interpreting Charts
Box and Whisker Plots
Two Way Tables
100
From this normal curve, the mean of this data is
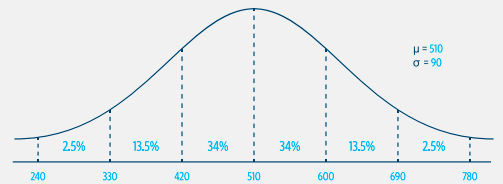
What is 510
100
Using these data points, the mode of these points is
10, 9, 5, 9, 3, 10, 7, 5, 4, 5, 10
What is 5 and 10
100
Looking at this line plot, they played this amount of hours on the Tennis game
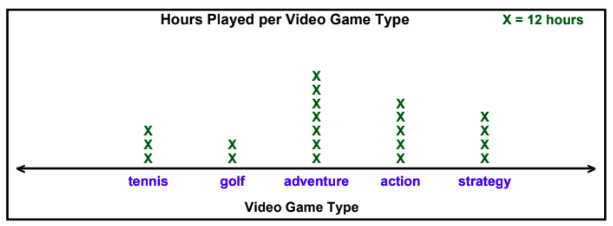
What is 36 hours
100
The minimum of this data set is
25, 8, 17, 9, 22, 13, 23, 19, 6, 18, 12
What is 6
100
From this table, out of all the males, this amount of them like bowling
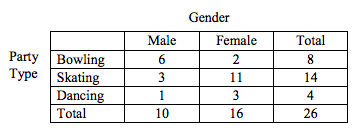
What is 6 males
200
The percent between -1 and 1 is
What is 68%
200
Using these data points, the mean of these points is
2, 1, 2, 1, 4, 5, 8, 6, 7
What is 4
200
Looking at this bar graph, this is the amount of pets sold during January and April
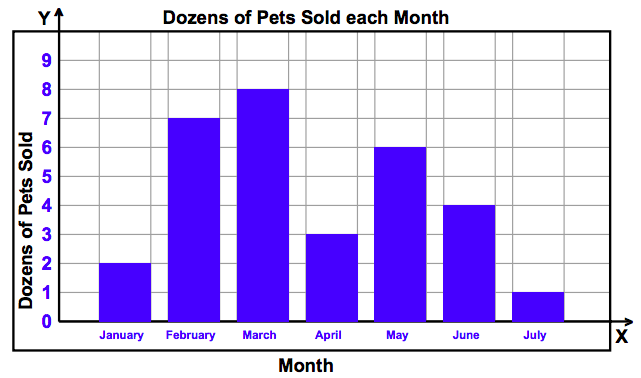
What is 60 pets
200
The median for this data set is
25, 8, 17, 9, 22, 13, 23, 19, 6, 18, 12
What is 17
200
From this incomplete table, this is the total amount of females surveyed
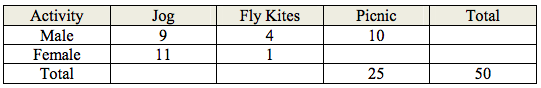
What is 27 females
300
The percent between -2 and 2 is
What is 95%
300
Using these data points, the range of these points is
8, 6, 5, 3, 4, 8, 9, 5
What is 6
300
Looking at this bar graph, the difference between March and June's amount of pets sold was
What is 48 pets
300
The Q1 for this data set is
15, 10, 22, 7, 19, 8, 22, 12, 16, 18, 12
10
300
From this incomplete relative frequency table, what value reflects adults with No I-Pod?
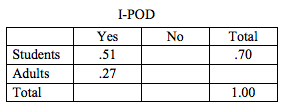
.03
400
The percent between -3 and 3 is
99.7%
400
Using these data points, the median of these points is
2, 4, 9, 8, 2, 5, 8, 9, 3, 7, 6, 9
What is 6.5
400
This pie chart represents the radio listeners favorite football team. Out of 400 listeners that called in, this amount voted for DA BEARS
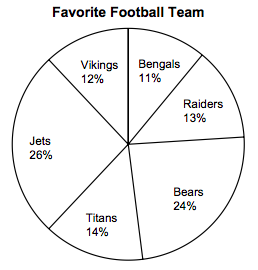
What is 96 listeners
400
The percent of students who watched more than 15 minutes of TV is

What is 75%
400
From this two way table, the percent of the population who are females who drive sports cars is (round to nearest whole number)

19% (45/240)
500
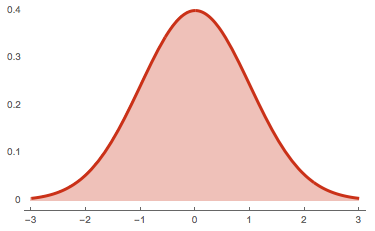
What does the zero on the graph represent (along the x-axis)?
the mean
500
When I add the number 3 to the original set, the (mean/median/mode/range) changes
Orignial set: 6, 3, 2, 3, 6, 3, 4, 2, 7
What is the mean
500
Looking at this chart, the red line represents # of dollars collected in 2010, and the blue line represents # of dollars collected in 2011. These dates in January show more dollars collected in 2010.
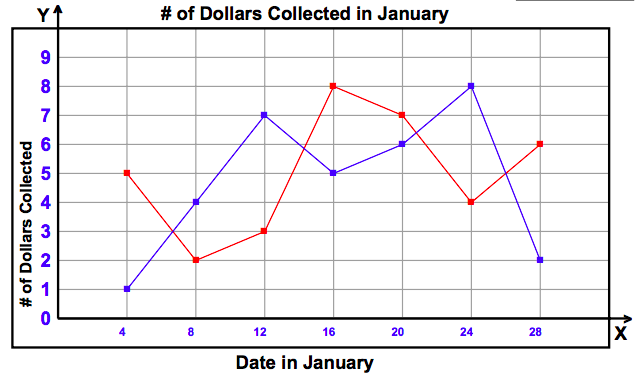
What are the 4th, 16th, 20th, and 28th
500
Comparing these box and whisker plots, the only difference in these scores is

What is the first quartile
500
Out of 700 people, this amount of females like to play laser tag
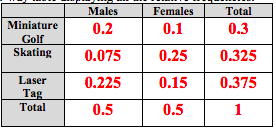
What is 105