Types of Data
Summary Statistics
Five Number Summary
Box Plots
Scatterplots
100
List the 4 types of data
Categorical ordinal, categorical nominal, numerical discrete, numerical continuous
100
Find the mean of the following data:
1, 3, 4, 4, 5, 5, 6, 6,
Mean = 4.25
100
What numbers are included in a 5 number summary?
Min, Q1, Q2/Median, Q3, Max
100
Label each value (1, 2, 3, 4, 5)

1 = Min
2 = Q1
3 = Q2/Median
4 = Q3
5 = Max
100
Describe the trend shown in the scatterplot.

The scatter plot has a strong negative correlation with one outlier. As motor vehicle age increases, the selling price decreases.
200
What type of data would the survey question ‘How many pairs of shoes do you own?' generate?
Numerical discrete
200
Find the range of the scores:
3, 4, 6, 9, 11, 12, 15
Range = 12
200
What is the lower quartile (Q1) for this data?
36, 38, 46, 30, 69, 31, 40, 37, 55, 34, 44, 33, 47, 42
Q1 = 34
200
75% of scores in a set of data will be lower than....?
a) The lower quartile (Q1)
b) The median
c) The upper quartile (Q3)
c) The upper quartile (Q3)
200
Draw a scatterplot for the following data:
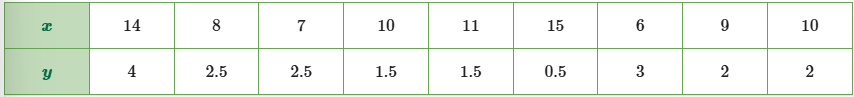

300
What type of data would be generated from this survey question - "What genres of film do you like to watch?”
Categorical nominal
300
What is the median of this set of scores?
3, 4, 6, 9, 11, 12, 15
Median = 9
300
Find the five number summary for the data below:
1, 6, 8, 9, 10, 12, 17, 19, 20, 21, 24, 25, 28, 31, 32, 36, 38, 39, 43, 43, 47, 52, 56
Min = 1
Q1 = 12
Median =25
Q3 =39
Max = 56
300
Find the 5 number summary of this box plot.

Min = 10
Q1 = 27 (approximately)
Q2 = 30
Q3 = 35
Max = 40
300
Using the two coordinates, find the equation of the least squares regression line:

y=30.1−1.2x
400
What type of data would be generated from this question -"How many siblings do you have?”
Numerical discrete
400
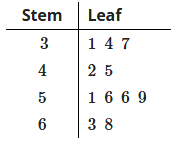
Find the interquartile range (IQR) of the stem and leaf plot

IQR = 23
400
Find the five number summary

Min = 24
Q1 = 25
Q2 = 26
Q3 = 26.5
Max = 29
400
Describe the shape of this box plot.

Negatively skewed
400
Sam graphed this data on a scatterplot and drew a line of best fit. He estimated the weight for a height of 2.5m
Discuss the reliability of this prediction.
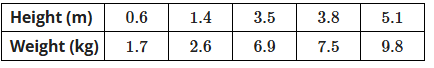
The prediction is reliable as it is interpolation (within the collected data range).
500
What type of data would be generated from "How long does it take you to run 100m?”
Numerical continuous
500
Does this data set contain outliers? Show all working out.
1, 4, 6, 7, 8, 9, 9, 11, 18
Lower fence = 5 - (1.5 x 5) = -2.5
Upper fence = 10 + (1.5 x 5) = 17.5
18 is an outlier.
500
Find the 5 number summary of the stem-and-leaf plot
Min = 31
Q1 = 37
Q2 = 51
Q3 = 59
Max = 68
500
Compare the cricketers results, focusing on centre and spread.

Centre: Batsman A has a higher median of approximately 32 runs, compared to Batsman B who had 25 runs.
Spread: Batsman B has the larger interquartile range (IQR = 17) compared to Batsman A whose IQR was 12.
500
The equation y=2.65t−8.1 represents the line of best fit for data relating the temperature (t∘C) of a greenhouse and the yield of seedlings (y kg) over a range of temperature settings.
Use the equation to estimate the yield for a temperature of 10∘C.
y = 2.65 x 10 - 8.1
y = 18.4
Prediction that at temperature of 10∘C, the yield of the seedlings will be 18.4kg.