Data Displays
Mean, Etc.
Median and Mode
Range and IQR
Miscellaneous
100
How many students were surveyed?

13 students
100
Find the mean.
13, 18, 13, 13, 14, 21, 13
What is 15?
100
Find the median and mode:
13, 18, 13, 14, 13, 16, 14, 21, 13
median: 14
mode: 13
100
Find the range.
Ages of Animals (years)
13, 18, 13, 14, 13, 16, 14, 21, 13
What is 8 years?
100
Is this a statistical question? Explain.
How many shoes do you have?
Yes, it is a statistical question. It has more than one correct answer. If you ask more than one person, you're going to get more than one answer.
200
What is the median?

3 pets
200
Find the mean.
8, 9, 0, 7, 0, 8
What is 5.3 or 5 1/3?
200
On a state licensing test, Jean and her friends got the following scores: 65, 78, 63, 78, 97, 42, and 53. What was their median score?
What is 65 points?
200
Find the range and IQR of this data.
Number of M & M's in a package.
12, 13, 13, 15, 10, 11, 11, 11, 10, 9
Range: 6 M & M's
IQR: 3 M & M's
200
What is the shape of the plot. What percent of the rebounds were 5 or more? 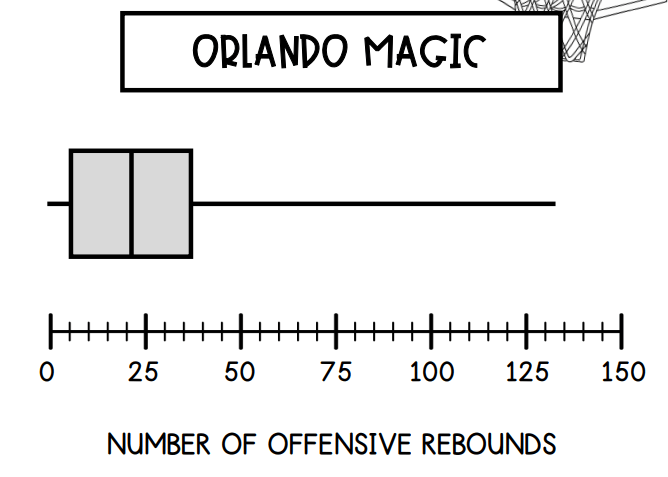
skewed right
75%
300
What is the IQR for South Mountain?

125 inches
300
Robert purchased season tickets for 8 football games. The cost was $176. What is the average price per game?
What is $22?
300
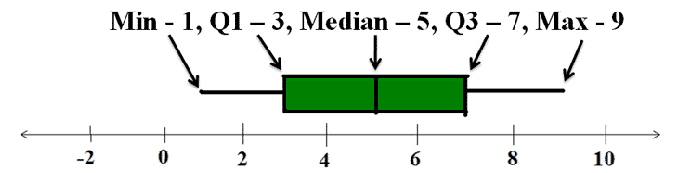
Name the 5 number summary for this box and whisker plot. Give the name of the point with its number.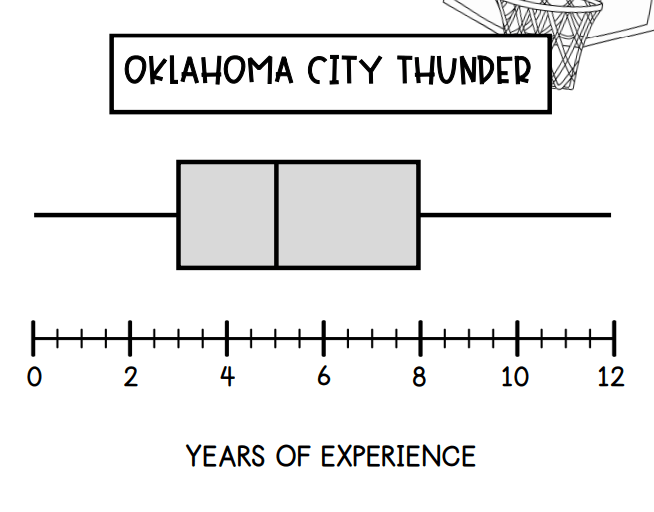
minimum or lower extreme: 0 years
first quartile or lower quartile: 3 years
median: 5 years
third quartile or upper quartile: 8 years
maximum or upper extreme: 12 years
300
Find the range and the interquartile range. 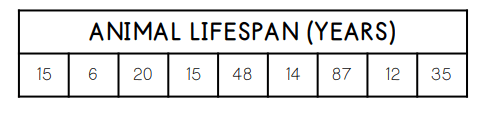
Range: 81 years
IQR: 28.5 years
300
Describe the shape of the histogram. How many runners ran less than three miles?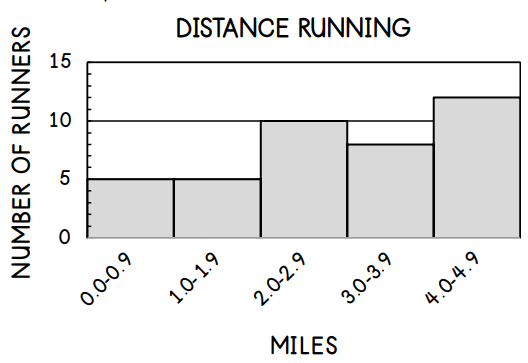
skewed left; 20 runners
400
Find the 5 number summary of the data below and make a box and whisker plot.
1, 2, 3, 3, 4, 4, 6, 6, 6, 8, 9, 9
400
Find the five number summary.
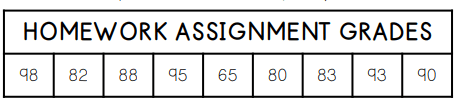
minimum: 65
first quartile: 81
median: 88
third quartile: 94
maximum: 98
400
Find the median and mode.
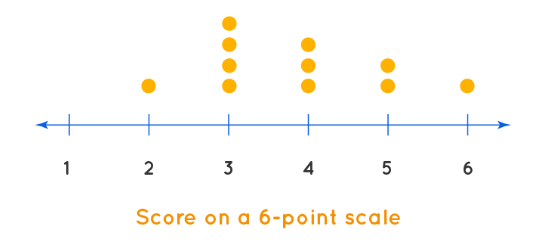
Median: 4 points
Mode: 3 points
400
Find and interpret the range and IQR.
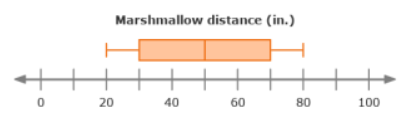
Range: 80-20= 60 inches
The distances vary by no more than 60 inches.
IQR: 70-30 = 40 inches
The middle 50% of the distances vary by no more than 40 inches.
400
Scientists measured 120 trees and graphed the data on the histogram below.
What percent of the trees are between 150 and 200 cm tall?
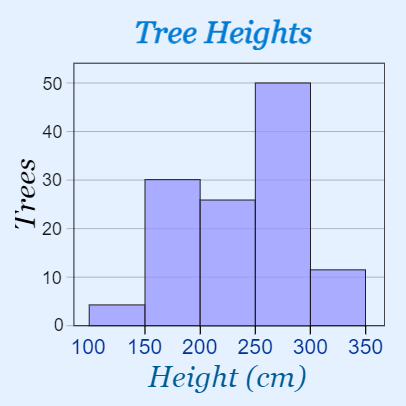
What is 25%?
30 out of 120
30/120 = 3/12 = 1/4
1/4 = 25/100
500
What fraction of students scored in between 60 and 100?
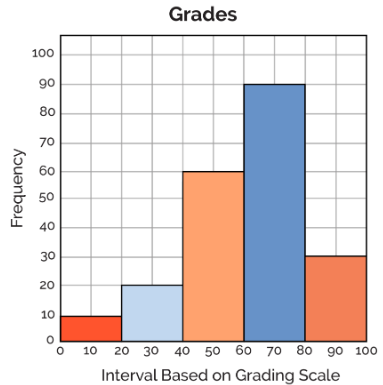
4/7
500
Find the mean, median, and mode.
Which measure of center is the best representation of the data?
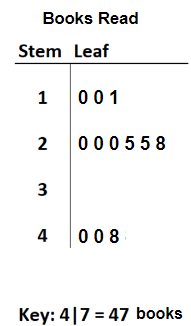
mean: 24.75 books
median: 22.5 books
mode: 20 books
The mode and median are a bit too low and don't represent the higher numbers. The mean is the best representation because it represents the lower numbers and the higher numbers.
500
Find the median, mode, mean, and range of the data.
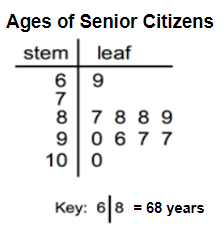
median: 89.5 years
mode: 88, 97 years
mean: 90.1 years
range: 31 years
500
Find and interpret the range and the interquartile range.
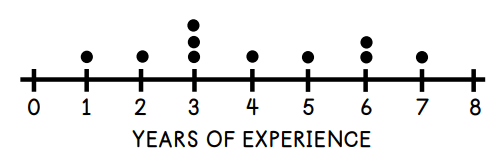
Range: 6 years
The data varies by no more than 6 years.
Interquartile Range: 3 years
The middle 50% of the data varies by no more than 3 years.
500
Find the mode, median, minimum, and maximum of the data.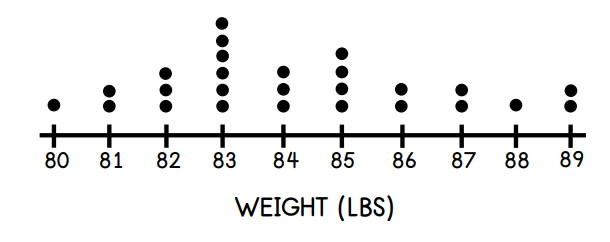
mode: 83
median: 84
minimum: 80
maximum: 89