Bar charts
Types of graphs
Mean, median, mode, range
PPDAC
Fractions
100
Which year group sold the most money?
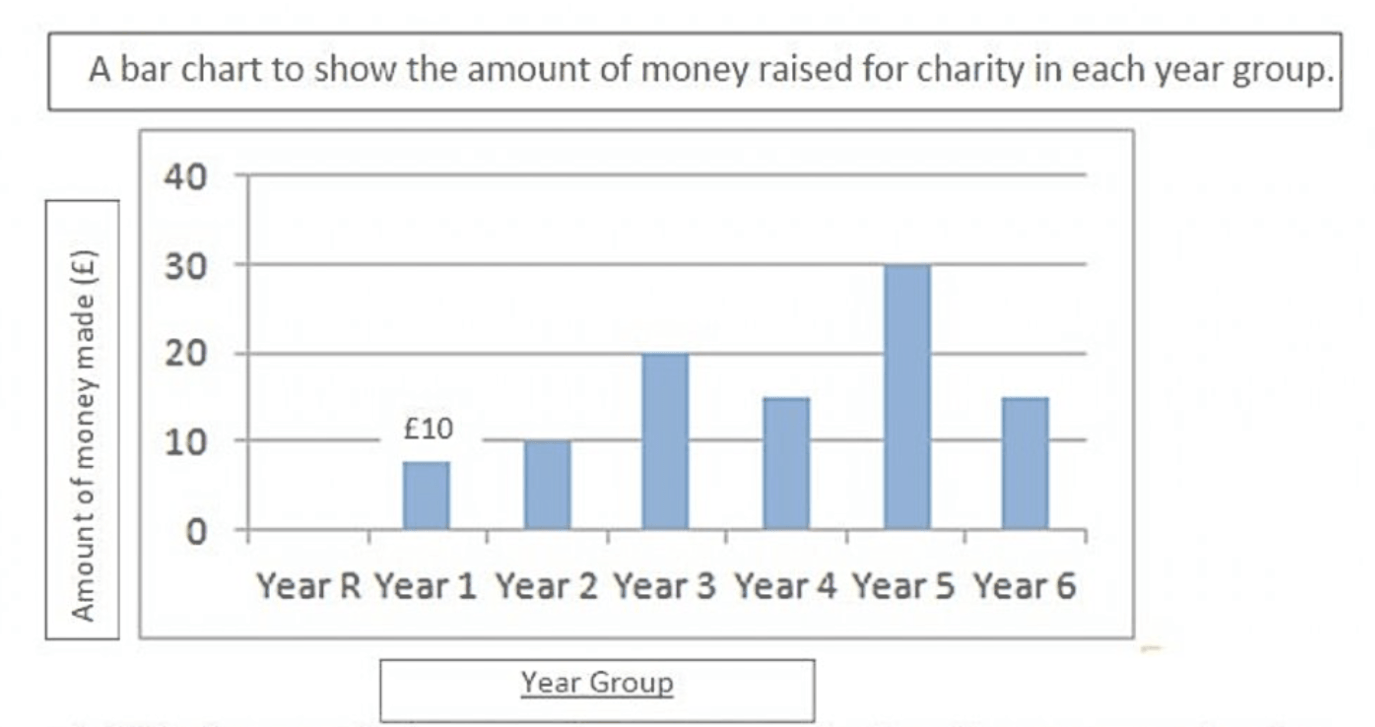
Year 5
100
What type of graph is this AND what is the biggest category?
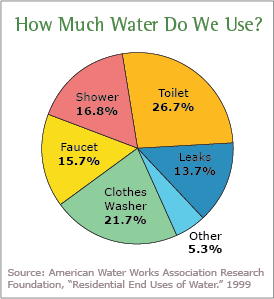
Pie chart
Toilet - 26.7%
100
What is a mode?
The most common value.
100
What does D stand for in PPDAC?
Data - collecting your data in a table.
100
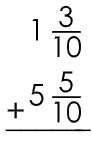
6 and 8/10
200
How much money did year 3 and 4 raise together?

$35
200
What type of graph is this AND what is the correlation?
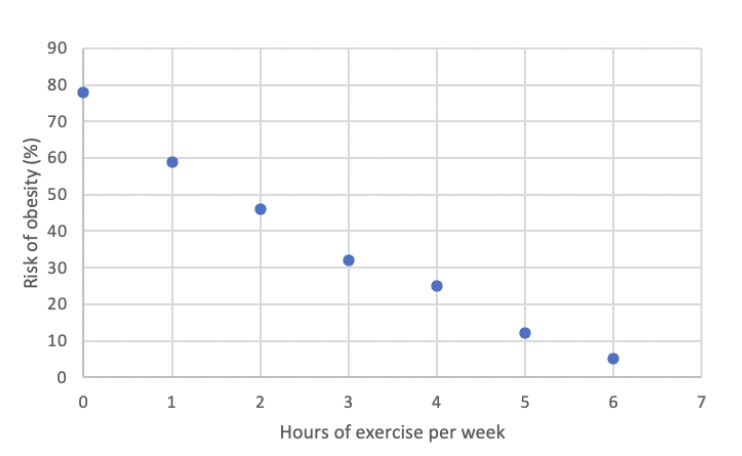
Scatter plot
Strong, negative correlation.
200
What is a median?
The middle value when all the numbers are in order of smallest to biggest.
200
What does A stand for in PPDAC?
Analyse - turning your data into a graph.
200
7/20 + 16/20 = 23/20 or 1 and 3/20
300
How much more money did year 5 raise than year 6?
$15
300
What type of graph is this AND when did the population hit 6 billion?

Line graph
1999
300
What is a range?
The biggest number minus the smallest number.
300
What does P stand for in PPDAC?
Problem - a question you have.
Plan - the plan for how you will carry out the investigation.
300
5/12 - 4/12 = 1/12
400
Does the independent variable ( the variable you change) go on the x (bottom) or y (side) axis?
x axis (bottom)
400
What type of graph is this?

Box and whisker.
400
What is a mean?
Where you add up all the values and divide by how many values you have.
400
What does C stand for in PPDAC?
Conclusion - statement at the end that summarises your results.
400
26/30 + 8/30 + 21/30 =
55/30
500
List 4 things wrong/missing with this graph.
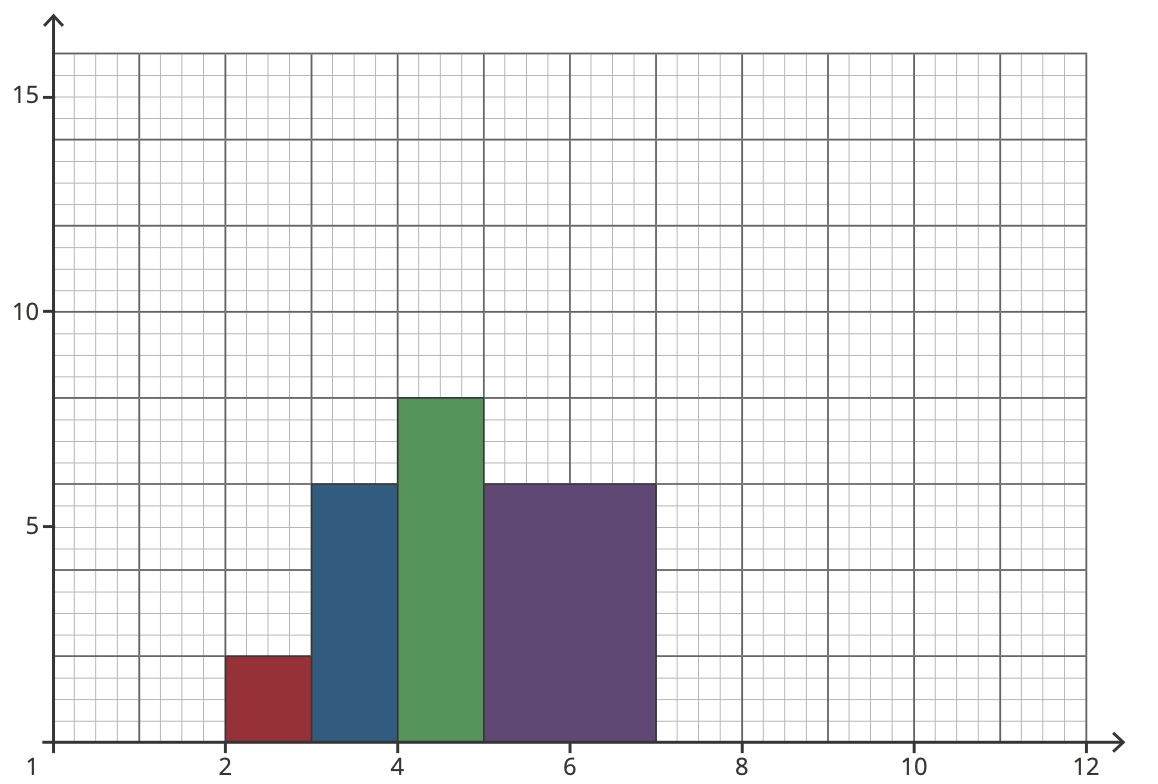
1. bars not separated
2. x axis not labelled
3. y axis not labelled
4. missing a title
5. x axis should be categories, not numbers
500
What type of graph is this?
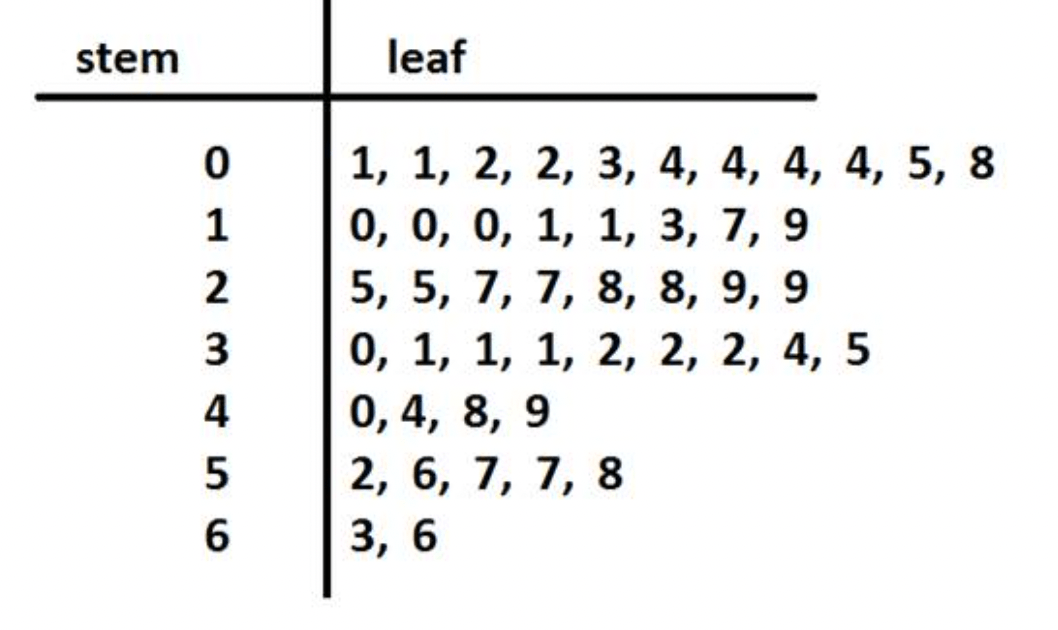
Stem and leaf plot
500
Calculate the range:
5, 3, 8, 2, 43, 29, 4, 3, 3, 41, 17
43 - 2 = 41
500
What does PPDAC stand for?
Problem
Plan
Data
Analyse
Conclusion
500
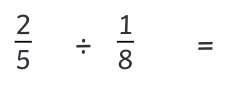
2/5 x 8/1 = 16/5