Graphs
Measures of Center
Boxplots
Calculate
100
This type of graph is known as 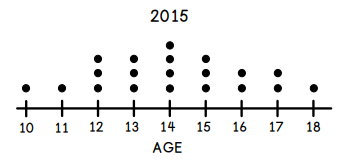
What is a dot plot?
100
Also known as the average.
What is mean?
100
The median number of Caramel Mocha Spice drinks sold in a day. 
What is 10?
100
This number is the mode for this data set
{ 1, 5, 8, 3, 6, 7, 2, 5, 6, 7, 5}
What is 5?
200
What is the name of this type of graph?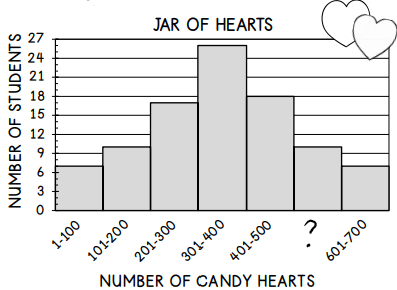
What is a histogram
200
Some refer to this measure as the "middle number."
What is median?
200
A five number summary is composed of these five points.
What are Min, Q1, Q2(Median), Q3, and Max?
200
This is the Median for this dataset?
1, 10, 8, 2, 3, 3, 6, 7, 1
What is 3 ?
300
The interquartile range is clearly displayed on this graph.
What is a boxplot?
300
No statistic has more occurrences than this value.
What is mode?
300
Which is the Maximum minus the Minimum?
What is the range?
300
This is the range of this dataset?
{1,5,7,6,2,7,3, 1}
What is 6?
400
This type of graph displays information using bins or intervals.
What is a histogram?
400
Name the two measures of center.
What is mean and median?
400
What is not displayed on a boxplot?
What is the mean?
400
This number is the IQR for the dataset
{1,2,4,6,8,9,10,18}
What is 6.5?
500
This type of graph has the median clearly labeled.
What is a box plot?
500
An outlier can have a huge effect on this measure.
What is mean.
500
Which drink had the day with the fewest drinks sold that week?

Neither- both have a minimum of 5
500
This is the mean of this dataset?
{1,5,7,6,2,7,3, 1}
4
600
The shape of this graph. 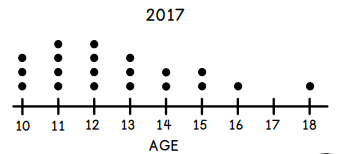
What is skewed right?
600
The best measure of center for this graph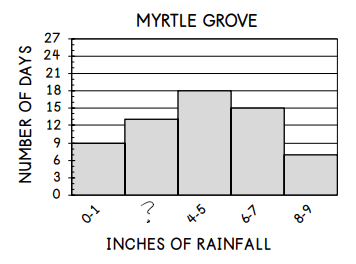
What is the mean?
600
The flavor latte which has more a consistent number of sales.
What is Caramel Mocha Spice?
600
Which dataset has a higher median?
1. {1, 10, 8, 2, 3, 3, 6, 7, 1} OR
2. {1, 5, 8, 3, 6, 7, 2, 5, 6, 7, 5}
Dataset 2
1000
The interval the median is located in. 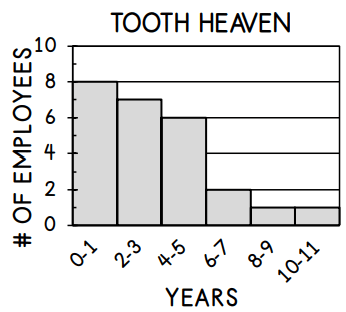
What is 2-3 years?
1000
The student with the symmetric data. 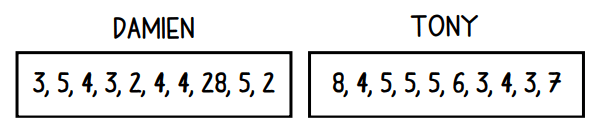
What is Tony?
1000
On the best 50% of days, which drink was better selling? 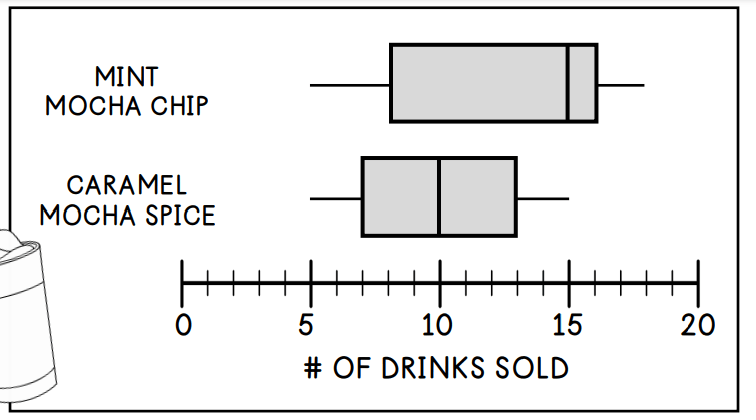
Mint Mocha Chip?
1000
Which class has a lower test average?
Class 1: 80, 85, 75, 80, 95
Class 2: 70, 65, 95, 85, 85, 100
Class 1