Foundations
Various Graphs
Only Box Plots
IQRs and MADs
Potpourri
100
Find the mean in this data:
28, 26, 30, 24, 70
35.6
100
In the histogram below, approximately how many 11 to 15 year old like M&M candy the most?

Approx 45 people between 11 to 15 years old
100
What percent of student scored between 30 and 70?
50%
100
What does the IQR and MAD measure in statistics?
IQR: Range of the middle 50% of the data
MAD: The average distance between each data point and the mean of the data set
100
In the series of words below, what is the mode?
PEN, PEN, CRAYON, MARKER, PEN, MARKER
PEN
200
Find the median and range of the data below:
7, 5, 2, 2, 6
median = 5
range = 5
200
Based on the histogram, what kind of distribution is shown (i.e. how is it skewed)?

Skewed right
200
What was the median quiz grade based on the box and whisker plot below?
Around 62 to 65
200
What are three steps to calculate MAD or mean aboslute deviation?
(1) Find the average of all the data
(2) Find the absolute value difference of the original data from the average.
(3) Find the average of the absolute value differences
200
On the circle below, what is the value of x and y?
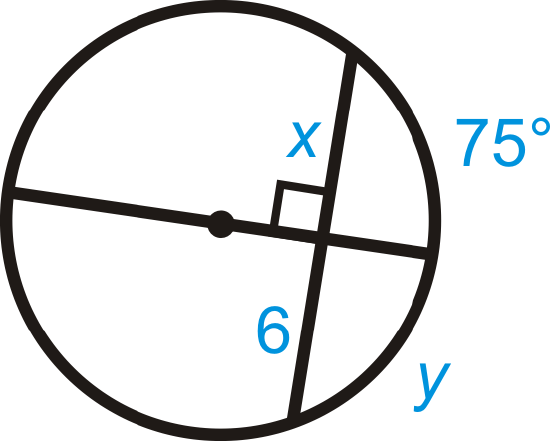
x=6
y=75 degrees
300
Listed below is the number of students who signed up for Driver's Ed over the past five years.
What is the average students per year?
22, 5, 20, 25, and 23
19 students per year
300
Based on the dot plot, what is the mode of the data?
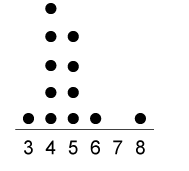
Mode = 4
300
What was the median time students spent reading based on the box and whisker plot below?
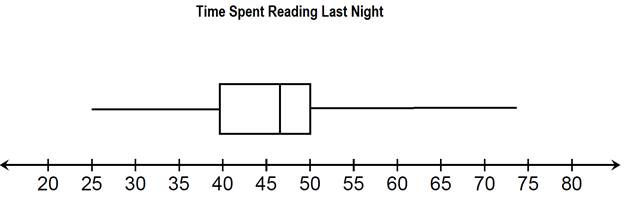
Around 47 minutes
300
Determint the IQR or interquartile range of the data below.

35-25=10
OR
Q3-Q1=IQR
300
What is the value of the missing angles?
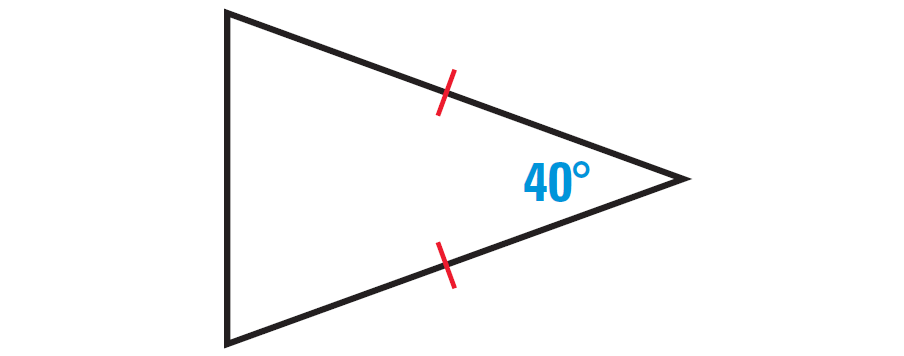
70 degrees each
400
Listed below are your quiz grades over the past semester. If your average score is 8.5, what was the first quiz grade?
_______, 8, 8, 9, 10, 10
First quiz grade: 6
400
Based on the histogram, what kind of distribution is shown (i.e. how is it skewed)?

Normal or Equal Distribution
400
What percentage of students read 50 minutes or more?
25%
400
Find the mean absolute deviation of the scores:
2, 3, 7, 8
2.5
400
In the circle below, if length BD is 8, what is the length of AB?
Hint: PT Theorem?
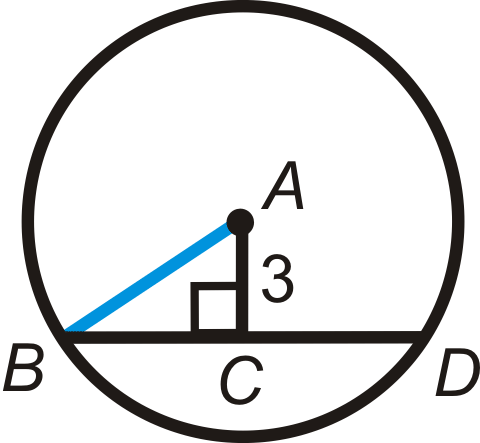
AB=5
500
If the mean is 32.5, what the missing data in the list below:
60, 20, __, 60, 5, 40
The missing data piece = 10
500
Based on the dot plot below, what is the mean?
Mean=4.75
500
Based on the data given, what quarter of scores were the most common on the 6th grade math test?

Approx. between 85 and 93
(i.e. Q3 to Q4)
500
Find the mean absolute deviation of the scores:
9, 6, 11, 9, 5, 8
Approx: 1.7
500
Rounded to the nearest tenth, what is the HEIGHT of the isosceles triangle below?
Hint: PT Theorem?

Approx. 4.6 centimeters