Data Measures
Box Plots
Histograms
Dot Plots
Shape of Data
Mixed Bag
100
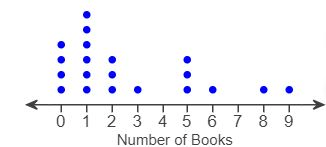
A teacher asked 20 students how many books they read last summer. The dot plot displays the data.
What is the MODE number of books read?
**Mode is the MOST dots or the MOST of the same number

1
On a dot plot the MODE is the TALLEST stack of dots. That means that number appears MORE than the others.
100
Find the first quartile of the following data:
10, 30, 12, 45, 36, 25, 37, 40, 42, 44
****they are not in order yet...
25
Put in order first:
10, 12, 25, 30, 36, 37, 40, 42, 44, 45
Median: between 36 and 37 = 36.5
Q1: the middle on the left side is 25
That is Q1 or the first quartile
100
The following histogram shows the ages of library visitors.
About how many people are between 60 and 80 years old?
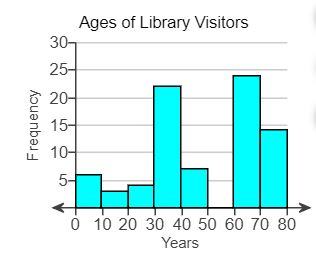
around 38 people
60-69 =24
70-79 =14
24+14 = 38 people
100
The following dot plot shows the number of hours 15 people exercised per week.
What is the greatest number of hours someone exercised?
9 hours is the highest number of hours
***This does not mean that most people did this many hours - it only means that someone did 9 hours and that is more than anyone else.
100
Which job has greater spread?
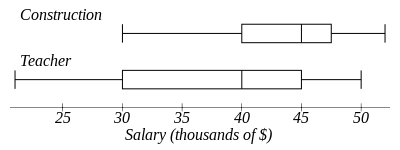
Teacher
Construction has a spread (range) of 55-30=25
Teacher has a spread (range) of 50-20 = 30
100
Is the following a statistical question or not? How many calories are in each hamburger at Red Robin?
Yes, it is a statistical question.
200
A teacher asked 20 students how many books they read last summer. The dot plot displays the data.
What is the RANGE of the number of books read?
9
Range = Highest - Lowest
Range = 9-0
Range = 9
200
Find Q3 of the following Data:
10, 30, 12, 45, 36, 25, 37, 40, 42, 44
42
Put in order first:
10, 12, 25, 30, 36, 37, 40, 42, 44, 45
Median: between 36 and 37 is 36.5
Q3: the middle of the data to the RIGHT of the Median is 42
200
The following histogram shows the ages of library visitors.
About how many people are less than 30?
About 12-14 people
0-9 = 6
10-19 = 3
21-29 = 4
6+4+3 = 13 people
200
The following dot plot shows the number of hours 15 people exercised per week.
Most people exercised _______ hours. MODE

1 hour
The tallest stack of dots is at 1 hour so that is the MODE.
200
What is the distribution shape of this data?
Symmetrical
200
What does the MAD tell us?
How varied the data is
300
A teacher asked 20 students how many books they read last summer. The dot plot displays the data.
What is the MEDIAN number of books read?

1.5
Cross off numbers left then right and keep doing this. You end up with 1 and 2 as the middle so you:
(1+2)/2 =1.5
300
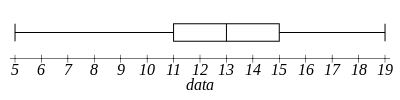
How many words does the fastest keyboarder type per minute?

95 WPM
The MAXIMUM is the point to the far right which is 95
300
The follow shows the distances people will drive to work.
About how many people drive more than 30 KM to work?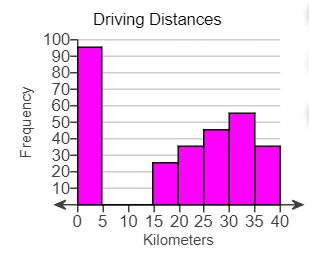
About 90 people
30-34 =55
35-39 = 35
55+35=90
300
The following dot plot shows the number of hours 15 people exercised per week.
Identify the outlier(s)
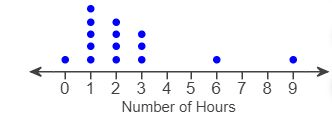
6 and 9 are both outliers
An outlier is a value that is "away" from the other values. There is usually a gap or it is much smaller or much larger than the other values.
300
T/F The upper quartile of Store A is less than the median of Store B.
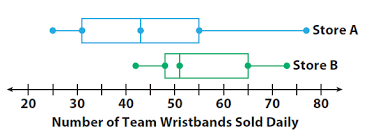
False
Store A's upper quartile (Q3) is 55
Store B's Median is about 51 or 52
55 is NOT LESS THAN 51 or 52 it is greater than it.
300
If one set of data has a MAD of 3 and the other a MAD of 5, What can you say about the set of data?
The MAd of 5 has more variation in the data.
400
A teacher asked 20 students how many books they read last summer. The dot plot displays the data.
What is the IQR of the number of books read?

4
To find the IQR, you need the 5-point summary:
Find the MEDIAN for Q2
Find the MEDIAN on the LEFT SIDE Q1
Find the MEDIAN on the RIGHT SIDE Q2
0,0,0,0,1,1,1,1,1,1,2,2,2,3,5,5,5,6,8,9
minimum:0
Q1: 1
Q2/Median (1+2)/2 = 1.5
Q3: 5
maximum:9
IQR = Q3 - Q1
IQR = 5 - 1 = 4
400
The top 50% types between ______ and _____ words per minute.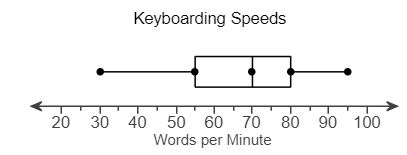
70 and 95
The Box plot is divided into FOUR SECTIONS. Each section is 25%. The TOP TWO sections would be 50% so this is between 70 and 95
400
The follow shows the distances people will drive to work.
How many people live very close to work?
About 95 people (0-5km is close!)
400
There is a cluster between ____ and ____

0 and 3
A "cluster" refers to a set of dots that have no gaps
400
This data is skewed left. True or False
False
The TAIL is going down on the RIGHT not the left.
It is skewed RIGHT
400
There are 7 animal shelters in the local area. The number of cats in each is 4, 6, 3, 7, 4, 5, and 20. What is the mean absolute deviation for the number of cats in shelters to the nearest tenth?
What is 3.7.
500
A teacher asked 20 students how many books they read last summer. The dot plot displays the data.
What is the MEAN number of books read?
2.65
Mean=
(0+0+0+0+1+1+1+1+1+1+2+2+2+3+5+5+5+6+8+9)/20 =2.65
500
The bottom 25% types between ____ and ____ words per minute.

30 and 55
The Box plot is divided into FOUR SECTIONS. Each section is 25%. The bottom 25% is between the DOT on the far LEFT and the first Part of the Box. So between 30 and 55 is the bottom 25%
500
The follow shows the distances people will drive to work.
About how many total people were surveyed?
290 people
0- 4= 95
15-19 = 25
20-24 = 35
25-29 =45
30-34 =55
35-39= 35
95+25+35+45+55+35=290
500
How many people exercised less than 3 hours?
10 people
0 = 1 person
1 = 5 people
2 = 4 people
3 = we can't count these because it said LESS THAN 3 and 3 is not "less than" 3
1+5+4 = 10 people
500
Describe outliers, gaps, and clusters
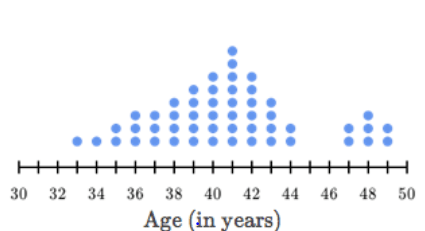
possible outliers 47 to 50
gap from 44 to 47
cluster around 47 to 50 another cluster around 35-44
500
Frank has 3 nickels, 5 dimes, and 2 quarters. Find the mean.
11.5 cents