Discrete v. Continuous
Graph
Statistics Show
Percentiles
Potpourri
100
What is the measure of variability, or dispersion of a random variable?
What is Variance?
100
A diagram in which the numerical values of variables are represented by the height or length of lines or rectangles of equal width
What is a Bar Graph?
100
Preferred measure of central location when the data set has extreme values.
What is Median?
100
Location of the pth percentile.
What is (p/100)(n+1) ?
100

What is a sample?
200
 Either a finite or infinite sequence of values such as 0, 1, 2, 3, …
What is a Discrete Random Variable?
200
A diagram consisting of rectangles whose area is proportional to the frequency of a variable and whose width is equal to the class interval
What is a Histogram?
200
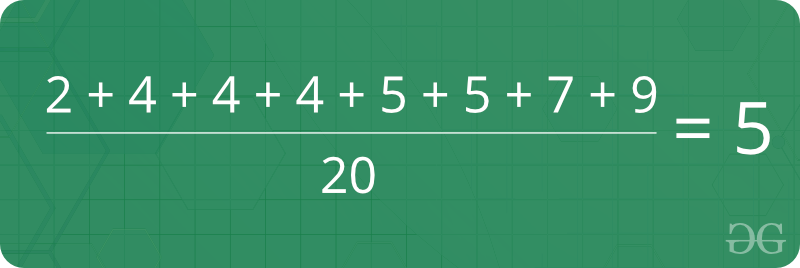 Provides a measure of central location.
What is mean?
200
Q3 + (IQR * 1.5).
What is the upper limit equation?
200
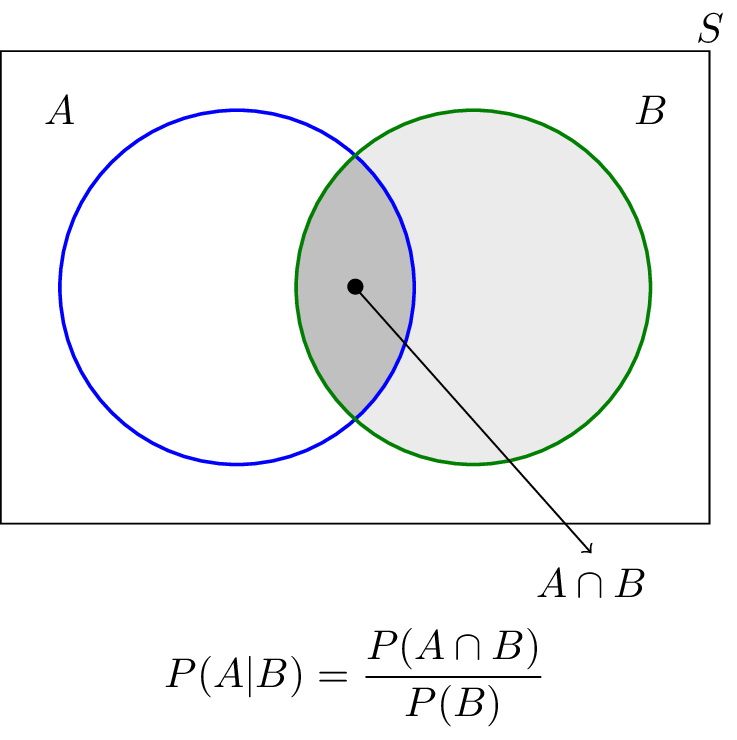 It’s a probability of an event given that another event has occurred; and it’s computed as followed (A given B has already occurred) P(A/B).
image url: https://www.probabilitycourse.com/chapter1/1_4_0_conditional_probability.php
What is Conditional Property?
300
A random variable that may assume any numerical value in an interval or collection of intervals is called...
What is a Continuous Random Variable
300
A type of graph in which a circle is divided into sectors that each represent a proportion of the whole.
What is a Pie Chart?
300
What is the symbol for population mean?
300
The lower limit equation
What is Q1 - (IQR *1.5)?
300
What is Correlation?
400
What is the use of the relative frequency method to develop discrete probability distributions?
What is Empirical Discrete Distribution?
400
A diagram that has histograms, boxplots, or dot plots in the margins of the x- and y-axes.
What is a Marginal Plot or Scatter Plot?
400
Measure of location that is calculated by finding the nth root of the product of n values.
What is geometric mean?
400
Q1 in the data set (17, 19, 19, 20, 21, 22, 22, 22, 22, 23, 23, 23, 24, 24, 27, 27, 29, 32, 34, 46).
What is 21.25?
400
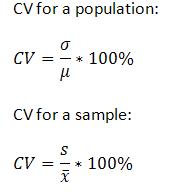
This indicates how large the Standard Deviation is in relation to the mean. (The Sample is denoted as [s / x-bar x 100] % and the Population is [ σ / μ x 100] %)
 https://www.google.com/url?sa=i&url=https%3A%2F%2Fwww.statisticshowto.com%2Fprobability-and-statistics%2Fhow-to-find-a-coefficient-of-variation%2F&psig=AOvVaw3Qos8dmE3Uy9qVYHLbu_9u&ust=1605975726814000&source=images&cd=vfe&ved=0CAIQjRxqFwoTCODq2fnDke0CFQAAAAAdAAAAABAD.
What is the Coefficient of Variation?
500
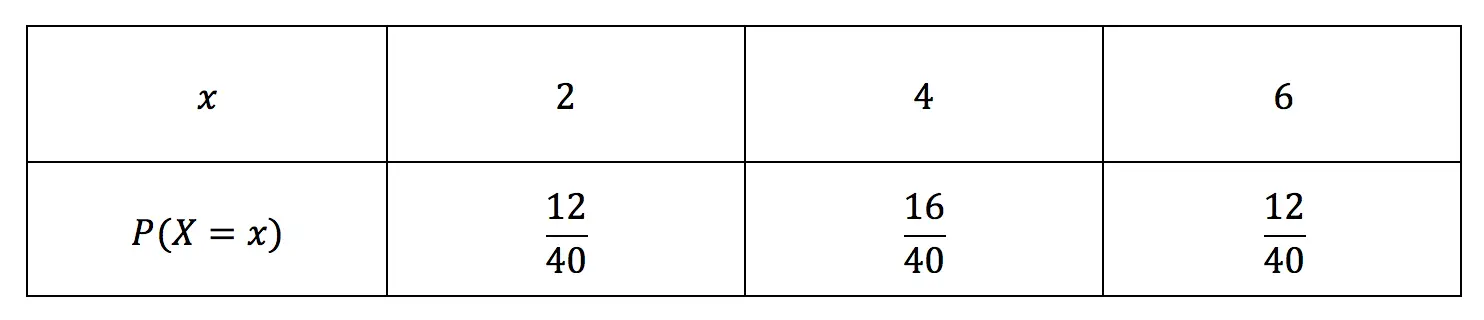
What describes how probabilities are distributed over the values of the random variable?
What is a Probability Distribution?
500
Y numerical X categorial compare measurement resolution
What is Dot Plot?
500
 Measures that are computed for data from a population.
What are the population parameters?
500
Upper limit in the data set (17, 19, 19, 20, 21, 22, 22, 22, 22, 23, 23, 23, 24, 24, 27, 27, 29, 32, 34, 46)
What is 35.625?
500
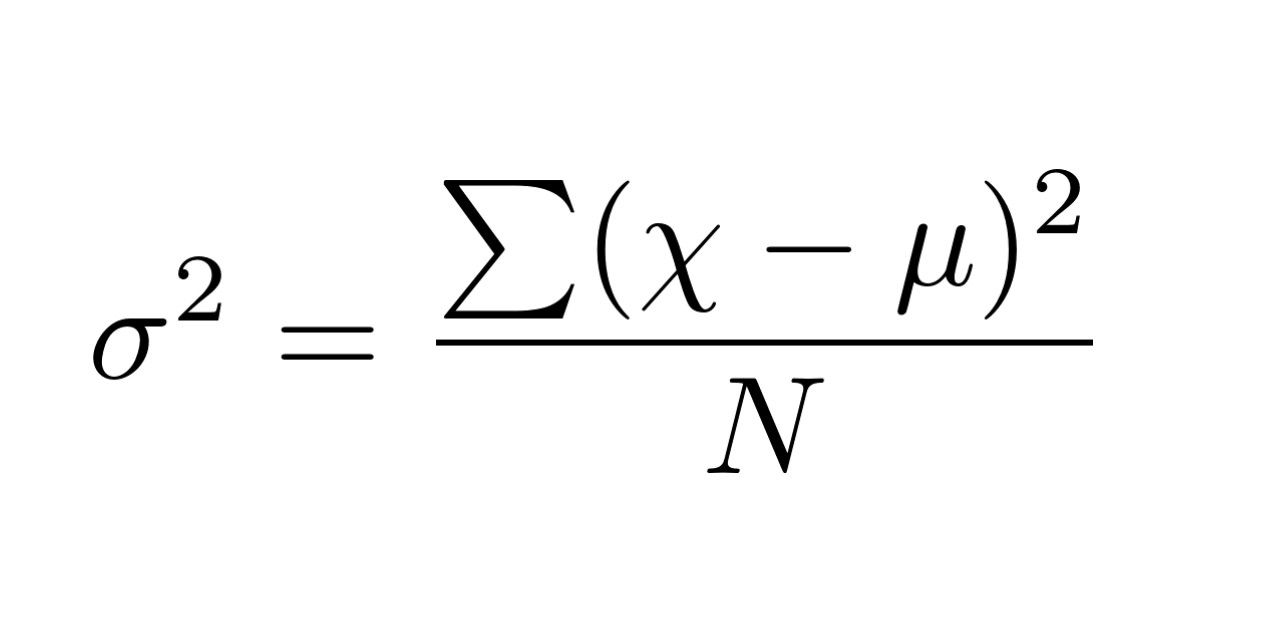 It’s useful for comparing the variability of 2 or more variables; it’s also the average of the squared deviations between each data value and the mean.
image url: https://deepai.org/machine-learning-glossary-and-terms/variance
What is Variance?