What is a bar chart?
What is statistics
the term statistics can refer to numerical facts such as averages, medians, percentages, and maximums that help us understand a variety of business and economic situations
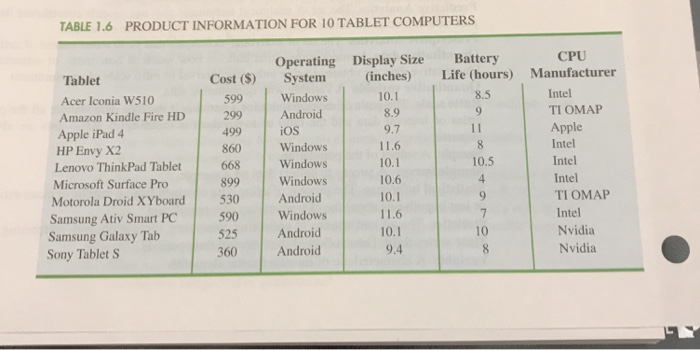
 . How many elements are in this data set?
What is 10?

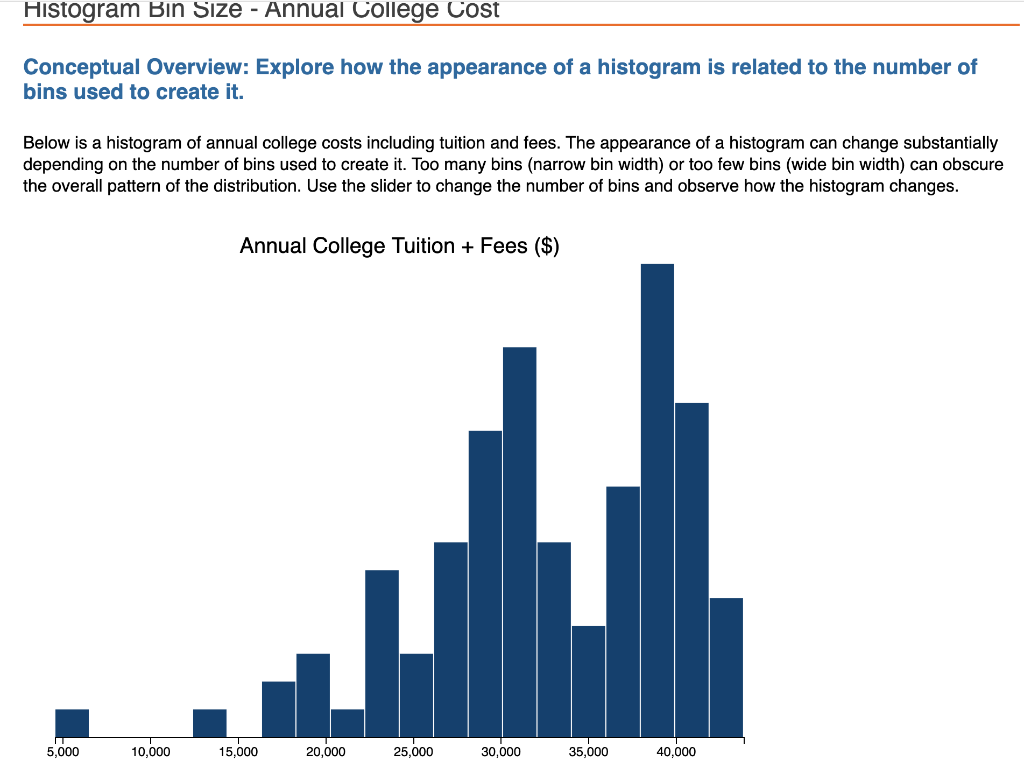
What is a histogram?
What is data?
Data are the facts and figures collected, analyzed and summarized for presentation and interpretation
In general, which of the following best describes the shape of this histogram? Skewed left, skewed right, or symmetrical?

What is skewed left?
What is a scatterplot?
What is data mining?
Methods for developing useful decision making information from large databases
Goals scored in a soccer game is an example of:
a categorical variable?
a quantitative variable?
neither a quantitative nor categorical variable?
or either a quantitative or categorical variable.
What is a quantitative variable?
What is a pie chart?
What does the number 5 represent in the table?
Sample Size
In a questionnaire, respondents are asked to mark their gender as male or female. The scale of measurement for gender is _____ scale.
A. Ratio
B. Interval
C. Nominal
D. Ordinal
What is nominal?
What is a box and whisker plot?
what is this graph?
Time Series Data
What is the set of measurements collected for a particular element called?
A. observation
B. variable
C. sample
D. population
What is observation?


