Overview of Statistics
Probability
More Probability
Types of Data
Levels of Measurement
Review!
Symbols
More Symbols
Graphical Displays
100
Information coming from observations, counts, measurements, or responses.
What is Data?
100
The ____ of an event is the set of all possible outcomes in a sample space that do not belong to the event of interest.
What is a Complement?
100
S={(H,H), (H,T), (T,H), (T,T)}
What is the Sample Space of flipping two coins?
100
Attributes, labels, or numerical entries.
What is Qualitative?
100
The same as Interval except 0 is an actual 0 and a measurement.
What is Ratio?
100
Quantitative or Qualitative?:
Age of your Car
What is Quantitative?
100
What does this symbol represent?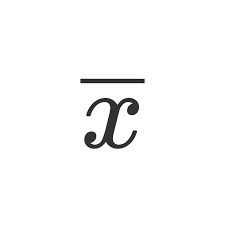
What is a Sample Mean?
100
P36
What is the 36th Percentile?
100
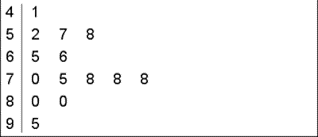
What is a Stem and Leaf Plot?
200
Science of collecting, organizing, analyzing, and interpreting data in order to make decisions.
What is Statistics?
200
Two events are said to be _____ if it is impossible for one event to have occurred knowing the other event occurred.
What is Mutually Exclusive?
200
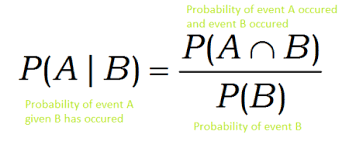
What is Conditional Probability formula?
200
Numerical measurements or counts.
What is Quantitative?
200
Qualitative or Quantitative. Categorized in order, or ranking but differences between data entries is not meaningful.
What is Ordinal?
200
Nominal, Ordinal, Interval, or Ratio:
Zip Codes
What is Nominal?
200
What does this symbol represent?
What is a Population Median?
200
What does this symbol represent?
pi
What is the Population Proportion?
200
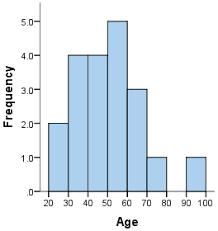
What is a Histogram?
300
All the members in a group.
What is Population?
300
The probability that event A will occur given event B has occurred.
What is Conditional Probability?
300
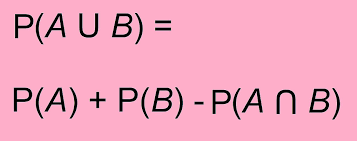
What is the General Addition Rule?
300
Quantitative measurement that cannot be counted like an average.
What is Continuous?
300
Can be ordered and meaningful differences between data entries can be calculated. 0 represents position on scale, not an actual 0.
What is Interval?
300
Nominal, Ordinal, Interval, or Ratio:
Calendar Dates
What is Interval?
300
What does this symbol represent?
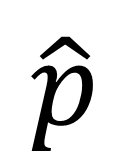
What is a Sample Proportion?
300
What does this symbol represent?
s
What is the Sample Standard Deviation?
300
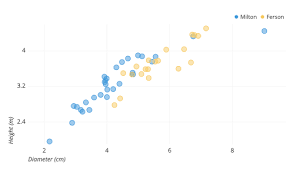
What is a Scatter Plot?
400
A subset, or part, of a population.
What is Sample?
400
The occurrence of one event does not effect the probability assigned to the occurrence of the second event.
What is Independence?
400
AC
What is the Complement of event A?
400
Can be counted like the number of wheels on a car.
What is Discrete?
400
Qualitative only. Categorized using names, labels, or qualities.
What is Nominal?
400
Nominal, Ordinal, Interval, or Ratio:
Age
What is Ratio?
400
What does this symbol represent?
What is a Population Variance?
400
What does this symbol represent?
r
What is Correlation?
400
What is the shape of this distribution?
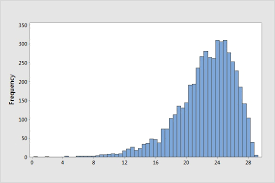
What is Left Skewed?
500
An official count of a population.
What is Census?
500
True or False?
If two events are mutually exclusive, then they must be independent.
What is False?
500
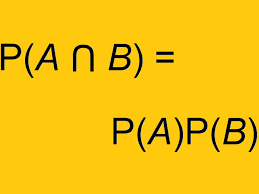
What is the Multiplication Rule for Independent Events?
500
Quantitative/Qualitative? Continuous/Discrete?
The measurement of how fast a car was going.
What is an example of Quantitative and Continuous Data?
500
ex. Types of dog breeds
What is Nominal?
500
Nominal, Ordinal, Interval, or Ratio:
Street Numbers
What is Ordinal?
500
Q_3
What is the Third Quartile?
500
What does this symbol represent?
What is the Population Mean?
500
What is the shape of this distribution?
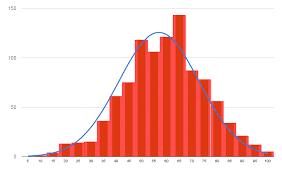
What is Normal/ Bell-Shaped?
600
A characteristic of interest about each individual element of a population or sample.
What is a Variable?
600
The Addition Rule simplifies to:
P(A or B) = P(A) + P(B)
when A and B are _____.
What is Mutually Exclusive?
600
What is the probability of rolling an even number on a fair die?
What is 3/6 = 1/2?
600
Quantitative/Qualitative? Continuous/Discrete?
The number of brown-eyed students in this classroom.
What is an example of Qualitative and Discrete Data?
600
ex. Weight of a vehicle
What is Ratio?
600
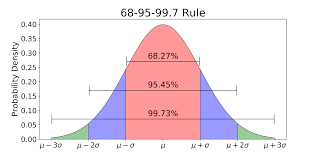
What is the Empirical Rule?
600
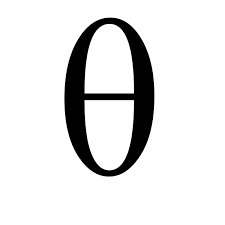
What does this symbol represent?
sum
What is a Summation?
600
What does this symbol represent?
sigma
What is the Population Standard Deviation?
600
What is the shape of this distribution?
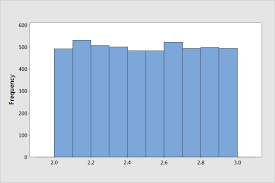
What is Uniform?