Graphs
I would like a Sample, Please!
The Best Laid Plans
One of These is Not Like the Others
One Thing Led to Another...
100
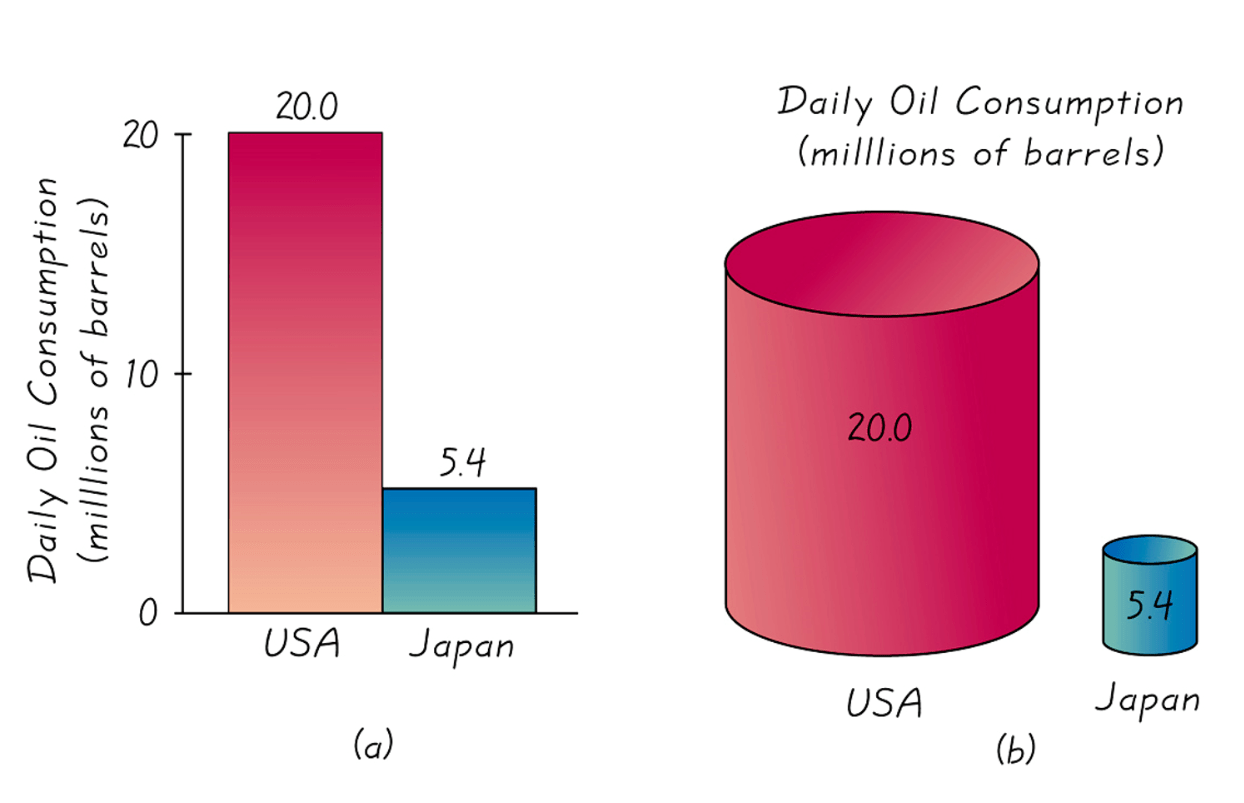
What is graph a? Graph b distorts the proportions exaggerating the difference between data.
100
In a large lecture room class of 300 students, a sample of 10 was taken to determine the male/female make up of the class. Which misuse of statistics does this represent?
A. Percentage.
B. Precise numbers.
C. Missing data.
D. Small samples.
What is Small sample?
100
Casualty data from the great flu epidemic of 1918 were collected for a study. This represents what type of study?
A. Cross-sectional.
B. Retrospective.
C. Prospective.
D. Qualitative
What is retrospective?
100
A sample value that lies very far away from the majority of the other sample values is
A. The center.
B. A distribution.
C. An outlier.
D.A variance.
What is an outlier?
100
Do SAT scores cause students’ success in college?
What is No?
Students with higher SAT scores are more likely to graduate from college and earn (on average) higher grades than students with low SAT scores, but they do not cause college success.
200
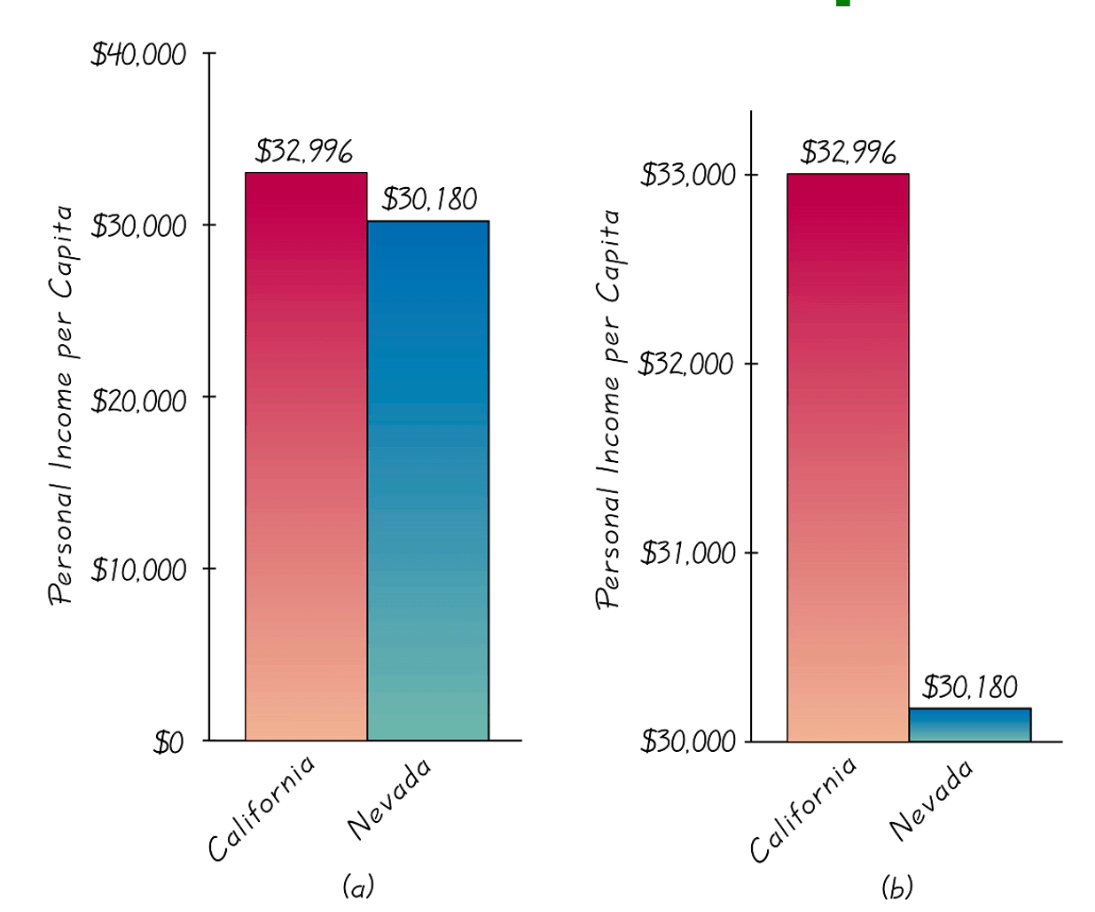
What is Graph a because the values start at 0?
200
At a security checkpoint to a government facility, every 10th individual was more thoroughly searched than the others. What type of sampling is this?
A. Systemic.
B. Convenience.
C. Stratified.
D. Cluster.
What is systemic?
200
David conducted an experiment where he observed and recorded the number of students who used the cross-walk when they crossed a busy street and the number of students who did not use the crosswalk to cross the street. Is this an example of an observational study or a designed experiment?
Answer: What is an observational study?
200
The median household income in the United States is approximately $80,610 for 2023 (before adjusting for inflation). How is the median income calculated?
What is by determining the income that divides all households into two equal halves? "Median" means the middle value. 50% earn less than the median and 50% earn more than the median. It does not get skewed by extremely high or low incomes (unlike the average/mean).
200
Sally concludes from her experiment that going to the gym and doing well on her exam are positively associated. She determines that if she goes to the gym the night before an exam, she will automatically do well and does not need to study for it. Why is this not the correct interpretation of her experiment?
What is Association does not imply causation?
300
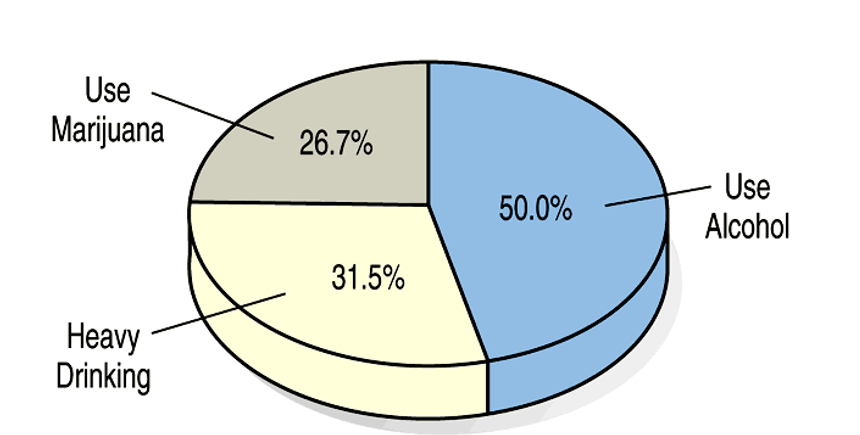
What is the percentages do not add to 100%?
300
You are looking at the students’ reviews on RateMyProfessor.com. Consider the students who left a review to be a sample of students who you have taught. How representative is that sample of the entire population of students who you have ever taught?
Answer: What is Not very? This is an example of a voluntary response sample. Although the reviews themselves are helpful at adjusting your teaching strategy, the ratings overall are not objective.
300
Sally is curious about the average number of hours all of the students in Biology were spending on homework for the class each week. Her professor teaches five sections of Biology. One morning, Sally waits outside the classroom and asks the first 40 students who walk into the 9 am section how many hours, on average, they spend on homework for the class. What sampling design does Sally use in this experiment?
Answer: What is Convenience sampling?
Convenience sampling causes undercoverage bias because Sally is not sampling the students in the other lecture times and she is only getting data from the first students arriving at class, missing students arriving late or who did not attend.
300
If Bill Gates would walk into the room right now, how would it affect the average income in the room?
What is it will get significantly higher?
300
Choose the error in the stated conclusion:
Given: There is a significant linear correlation between the number of homicides in a town and the number of movie theaters in a town.
Conclusion: Building more movie theaters will cause the homicide rate to rise.
A. Correlation implies causality
B. Data based on averages
C. Property of linearity
What is Correlation implies causation?
400

Answer: What is differences in population for each country and per capita car thefts?
400
A maternity ward at a local hospital consistently gets 2 stars ratings. The surveys are given to the patients when they are discharged from the hospital to fill out at home and mail in. Would you rely on the ratings and choose a different hospital?
Answer: What is Not at all? That is another example of a voluntary response sample, but more extreme. Where hospitals are concerned, usually very few patients who are happy with their experience leave a review, especially if it has to be filled out and mailed in after the stay.
400
Jim ran an experiment about the proportion of people who prefer chocolate ice cream over vanilla. To gather data, Jim set up a table on his college campus and people came up and took the survey. Is there any bias present that could prevent Jim from reaching an objective conclusion?
Answer: What is voluntary sampling?
The students had to choose to participate in the survey; therefore, Jim is missing a large number of people. This is an example of undercoverage.
400
If Bill Gates would walk into the room right now, how would it affect the median income in the room?
What is it will not change significantly if at all?
400
Nations with higher the number of electronic devices per person have higher life expectancy. Could there be an explanation to this connection?
What is Rich nations vs poor nations?
500
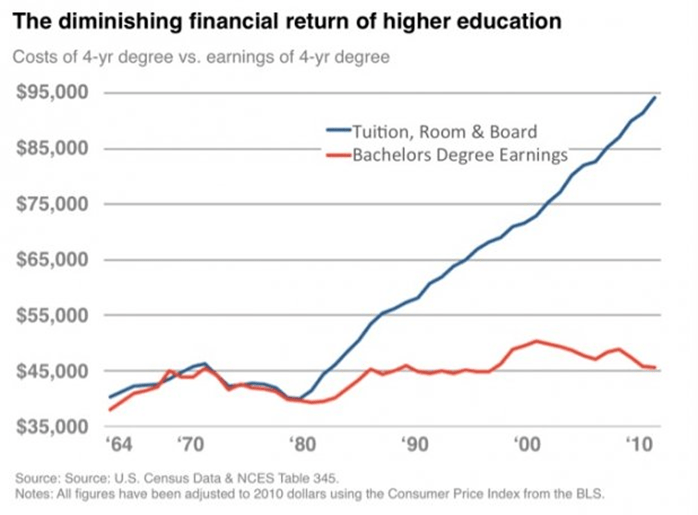
What is total cost of tuition vs annual income?
500
To gather detailed consumer insights, Amazon uses invitation-only shopper panel. The users upload receipts from purchases made outside Amazon and fill-out surveys that include questions about their age, income, purchase habits, brand awareness, etc.. Participants receive monthly rewards (e.g. Amazon credit). Are the reviews left by the members of shopper panel unbiased?
Answer: What is the reviews are biased? Participants are encouraged to participate by getting Amazon credit.
500
Anna wants to know the proportion of college students who like coffee. She wants to have each grade to be equally represented. She takes a random sample of 100 students from each grade level.
Is this an example of
A. Block design
B. Stratified sampling
C. Simple random sampling?
What is stratified sampling?
500
A researcher studied the number of traffic accidents that were attributed to driver fatigue at different times of the day. He notices that the number of accidents was higher in the late afternoon (between 5 pm and 6 pm) than in the early afternoon (between 1 pm and 2 pm). He concluded that the driver fatigue plays a more prominent role in traffic accidents in the late afternoon than in the early afternoon. Is this conclusion justified?
What is No? There is more drivers on the road in the late afternoon. The researcher should consider the proportion of accidents to the overall number of cars on the road instead.
500
A study conducted at Nova Southeastern University, Fort Lauderdale, Florida, using Fall 2004 data, compared grades for online learning and in-person classes. The conclusion was that “for undergraduate and graduate students there was general parity in grades between distance education (site‑based) and campus‑based students — i.e., distance‑education students did roughly as well as campus students overall”. Considering that the study was done pre-pandemic, could there be another explanation to why the difference in grades was not significant in this instance?
What is Overall students preparedness for the course? The students who took distance learning courses were better prepared overall (the average on the pretest was 40.70 for distance learners vs 27.64 for in-person learners)