Basic Statistics
Plots and Histograms
Challenging Questions
Bonus Review
100
Which is an example of a statistical question.
A. How many letters are in my name?
B. What is my favorite subject in school?
C. How many televisions are in my house?
D. What are the heights of the students in my history class?
What are the heights of the students in my history class?
100
Ms. Leah asked her students how many hours they spend studying each week. She created the histogram below from the results.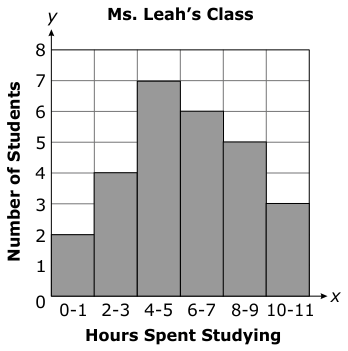
How many students spent at least 8 hours per week studying?
8
100
If the mean (average) of a set of 6 numbers is 15, which of the following statements must be true?
A. The median of the set of numbers is 12.
B. The range of the set of numbers is 48.
C. The sum of the set of numbers is 90.
D. The mode of the set of numbers is 15.
C. The sum of the set of numbers is 90.
100
5x - 3 = 12
Solve for x
x = 3
200
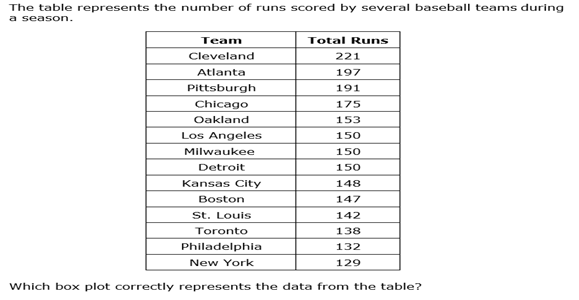
This is number 8 on your practice quiz. Look at the tables on your practice quiz to answer the question.
A band performed concerts in four different states. In each state, the band played concerts in four different cities. The tables show the number of people attending each concert in each city.
Which state has the largest amount of variation in the number of people attending?
Oregon
200
What value represents the upper quartile on the box plot below?
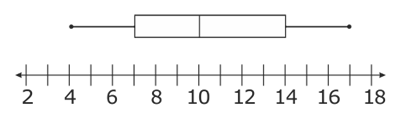
14
200
This list shows the scores for each of Sarah’s homework assignments: 100, 95, 47, 83, 87, 89, 89.
If the score 47 is removed from the list, which of the following statements is true?
A. The mean will remain the same.
B. The mean will increase by 47.
C. The mean will increase by about 6.
D. The mean will decrease.
C. The mean will increase by about 6.
200
Which is an equivalent ratio to 81:36?
A. 9:6
B. 3:2
C. 243:72
D. 9:4
D. 9:4
300
A store sells loaves of bread. The table below shows the number of loaves of bread sold each day for a week.
Loaves of Bread Sold
Day Number of Loaves Sold
Monday 41
Tuesday 72
Wednesday 41
Thursday 35
Friday 68
Saturday 80
Sunday 83
The difference between the mean and median of loaves of bread sold is....
8
300
Amy recorded the heights, in inches, of all the students in her class. She created the dot plot below with these data.
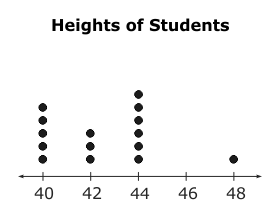
What is the median height of the students in Amy’s class?
42 inches
300
Carol Anna
Monday 60 45
Tuesday 30 35
Wednesday 20 60
Thursday 70 65
Friday 45 30
Which statement is true?
A. Carol's mean for the number of minutes she walked is equal to her median.
B. Carol's mean for the number of minutes she walked is greater than Anna's mean.
C. Anna's median for the number of minutes she walked is greater than her mean.
D. Anna's mean for the number of minutes she walked is equal to Carol's mean.
A. Carol's mean for the number of minutes she walked is equal to her median.
300
Cheeseburgers are two for $5.00. How much would 5 cheeseburgers cost?
$12.50
400
A list of numbers is as follows: 7, 14, 15, 9, 11, 14, 11, 10, 17. What is the mean of that set of numbers?
12
400
Provide the answer letter choice from your practice quiz.
The answer is letter A
400
Jamal scored 62, 75, 76, and 90 on four tests. What does he need to score on the fifth test in order to have a mean of exactly 80?
97
400
3 3/4 divided by 4 1/2. Your answer must be simplified.
5/6