Measures of Center
Measures of Variation
Statistical Questions
Box and Whisker
Dot Plots
100
The mean of this data set:
1, 0, 11, 15, 7
What is 6.8
100
Is there an outlier for this set of numbers & if so, what is it?
0, 9, 3, 6, 4, 1, 16, 8, 2
Yes, outlier is 16
100
Would this be considered bias or unbias?
"Bob McBobby asked a friend how many pets he has"
Bias, he did not ask enough people (sample size too small)
100
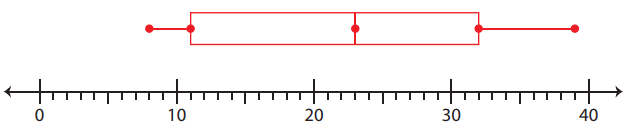
The median of this Box and Whisker Plot:
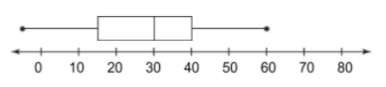
What is 30?
100
The mode of this frequency table:
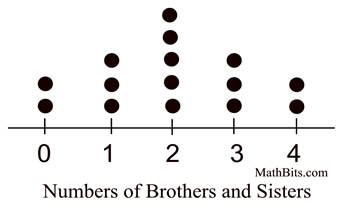
What is 2?
200
The mode of this data set:
6, 5, 2, 9, 6, 3, 0
What is 6?
200
The range of this data set:
4, 7, 9, 2, 4, 9, 12, 6
What is 10?
200
Would this be considered bias or unbias?
"Charles randomly asked 5 people playing chess if they liked playing chess"
Bias, if they only ask people playing chess then that does not reflect a general population
200
The minimum of this Box and Whisker Plot:

What is 15?
200
Use the data set to create a dot plot
0, 1, 1, 1, 2, 2, 2, 2, 3, 3, 4, 6
300
The median of this data set:
0, 1, 3, 5, 6, 8, 9
What is 5?
300
Is there an outlier for this set of numbers & if so, what is it?
1, 1, 1, 4, 7, 3, 8, 2, 1
No outliers
300
Would this be considered bias or unbias?
"Cindy randomly chose 13 people's name out of a hat and asked them how many people live in their house"
Unbias. Good sample size and it was random.
300
The Upper Quartile (Q3) of this Box and Whisker Plot: 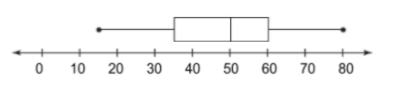
What is 60?
300
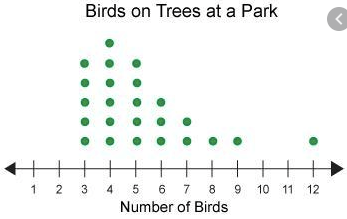
What is the mean for this graph? Round to nearest tenth.
15.7
400
The median of this data set:
6, 4, 0, 1, 7, 2, 5, 3,
What is 3.5?
400
What is the range of this set of numbers:
11, 13, 12, 19, 31, 17, 29, 88
77
400
Would this be considered bias or unbias?
"A student asked every 5th person who entered the cafeteria who they were going to vote for for student elections"
Unbias. It is random and can get a large sample size
400
What percentage of the data is represented between 30 and 60?
50%
400
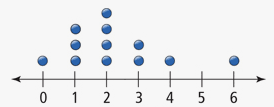
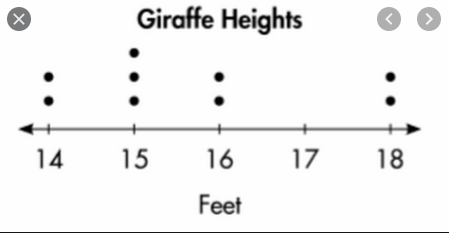
What is the range of this dot plot?
9
500
The mean of this data set:
3, 8, 7, 4, 9, 5, 6, 6, 10, 2
What is 6
500
If quartile 1 is 5 and quartile 3 is 11, what is the interquartile range?
11 - 5 = 6
Interquartile range is 6
500
You ask 50 random artists in your school about their favorite art form. There are 800 students in your school. Estimate the number of students in school who answer photography.
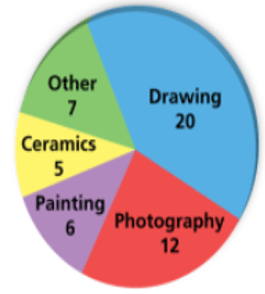
12/50 = 0.24
0.24 x 800 = 192
We would expect 192 students to say photography
500
Create a box and whisker plot for the data:
17, 29, 32, 9, 30, 14, 8, 39, 11, 32, 23
500
What is the outlier from this dot plot?
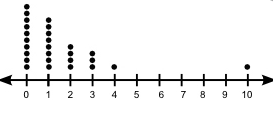
10