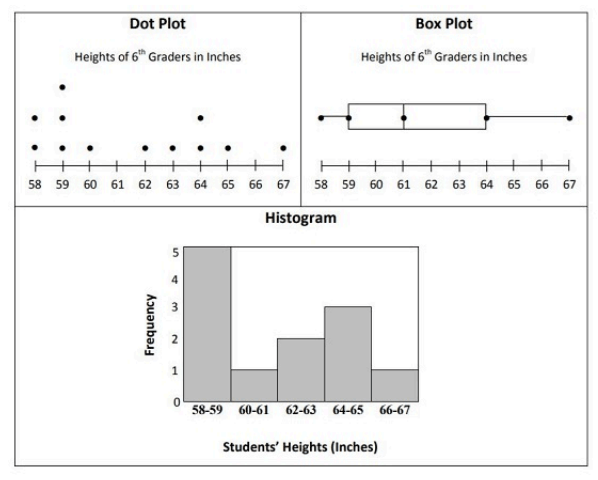
Dot Plots & Histograms
Box Plots
Quick Calculations
Mean or Median?
Mixed Topics
100
Question 1:
The list shows the number of students in different school clubs.
14, 15, 19, 26, 27, 27, 28, 30, 30, 31, 31
Which dot plot best represents this list?
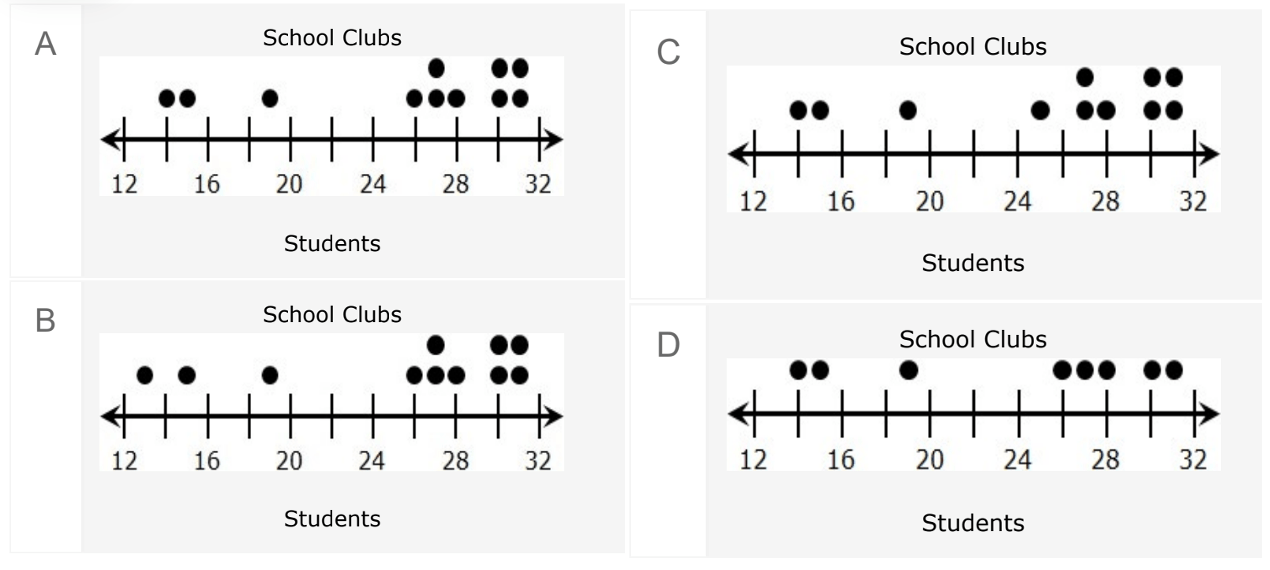
A.
100
Question 7:
Mr. McGregor kept track of the number of e-mails he received each day last month. His data are shown in the box
plot.
What is the median number of e-mails Mr. McGregor received per day last month?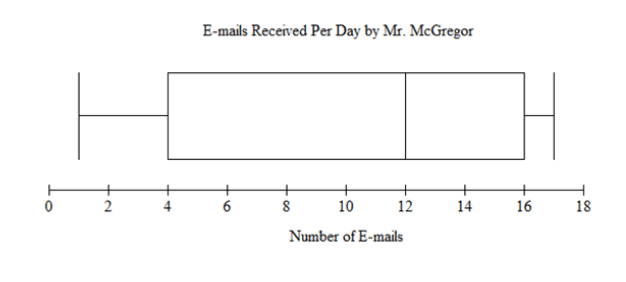
12
100
The median of the set {0, 0, 4, 6, 6, 8} is ___.
5
100
A CEO is trying to determine the salary of a typical worker. He has some workers that work part-time and a few very highly paid workers. If he wants a true idea of typical worker's salary, what summary statistic should he use?
Median
highly paid workers are an outlier; he wants ACCURACY
100
Question 9:
Select the following statistical question that would describe the data given in the table.
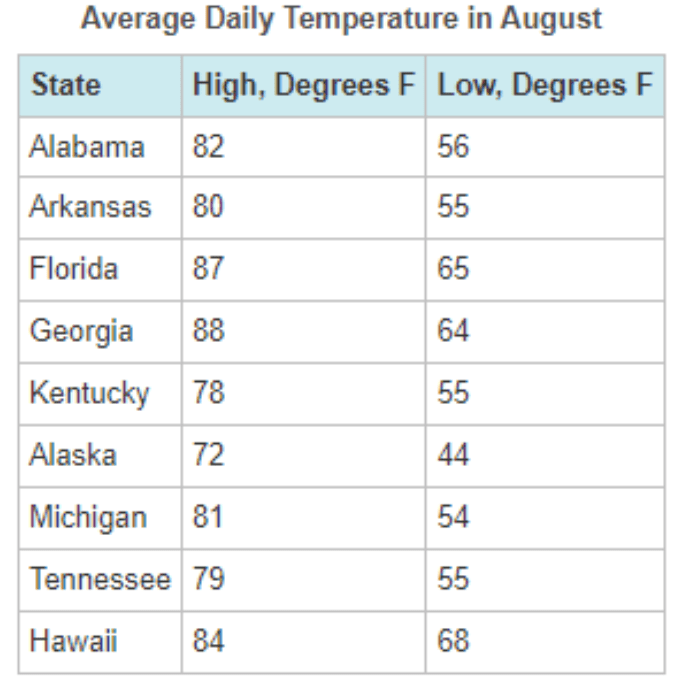
- A --Which state was the coldest to live in?
- B -- What was the average daily high temperature in Alabama?
- C -- What was the highest and lowest daily temperature in each state in August?
- D -- What was the average daily low temperature in Hawaii?
C.
200
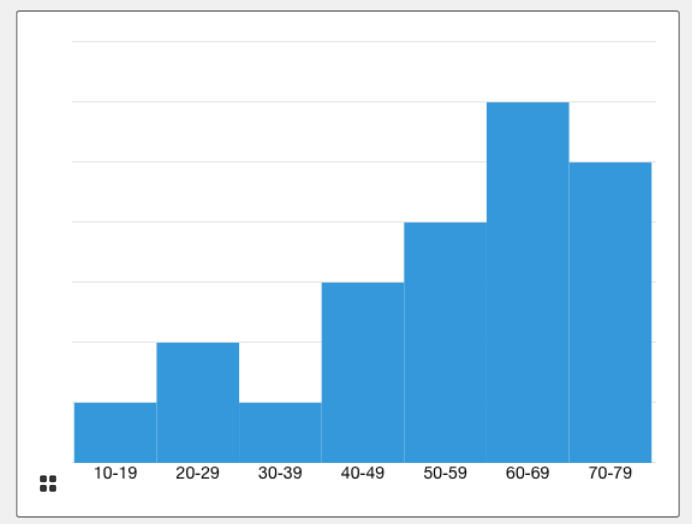
Question 6:
Which statement about the data in the histogram must be true?
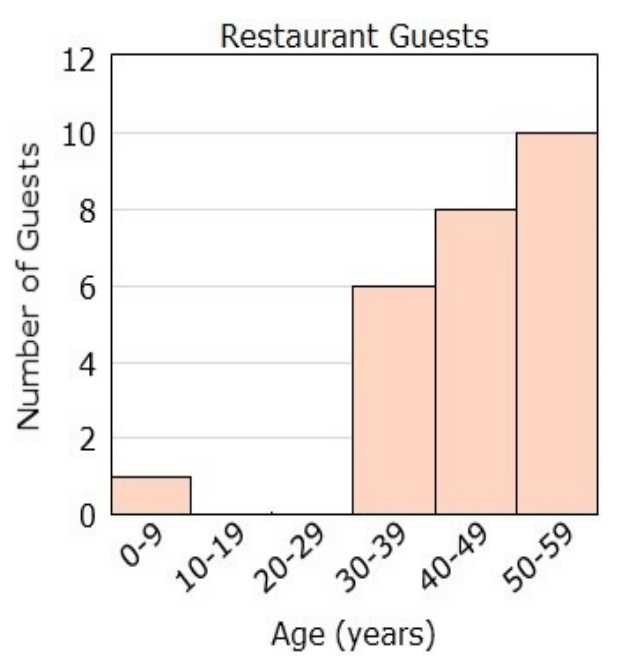
A The data represent 25 restaurant guests.
B The range of ages is 59.
C The oldest restaurant guest is 59.
D The mean age of restaurant guests is 30.
A.
200
Question 2:
The tips Darryl earned on his last 11 shifts are shown below.
41, 43, 43, 45, 47, 48, 49, 50, 50, 51, 51
Which box and whisker plot best represents these data?
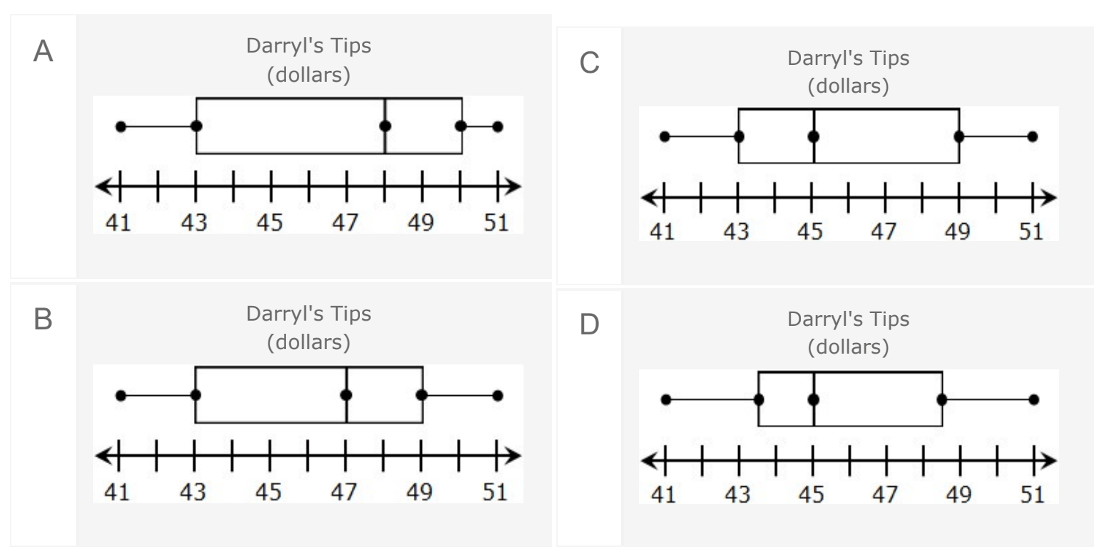
A.
200
The range of the set {0, 0, 4, 6, 6, 8} is ___.
8
200
 Should we use the mean or median?
Median
200
Question 14:
Taz is tracking the number of downloads he gets on each song of his new album. He collects the following data:
Song downloads = {300, 400, 280, 360, 390, 790, 260, 330, 410, 380}
The mean will:
A. decrease by 44.4
B. increase 44.4
C. decrease by 72.4
D. increase by 72.4
A. decrease by 44.4
300
Question 8: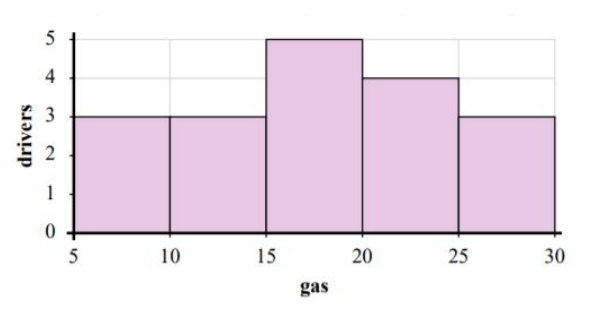
How many drivers purchased between 20 and 25 gallons of gas?
4
300
Question 10:
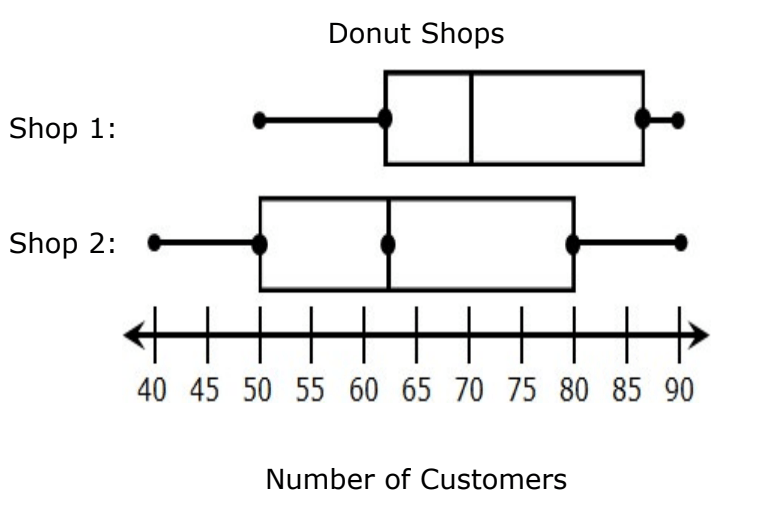
A -- The range of customers for Shop 1 is 50.
B -- For half the days at Shop 2, the number of customers was less than 50.
C -- For half the days at Shop 1, the number of customers was between 50 and 80.
D -- The range of customers for Shop 2 is 50.
D.
300
How many modes does the set {0, 0, 4, 6, 6, 8} have?
2
300
Workers at a plant are trying to show that they work too many hours. There are five part-time workers along with ten full time works. What summary statistic would best defend their position?
Median
Part-time workers will drag down their mean and not help defend they work TOO much.
300
Question 3:
Which graph displays can be used to find the median
and the interquartile range of the data?
A box plot and dot plot only
B box plot and histogram only
C histogram and dot plot only
D box plot, dot plot, and histogram
A.
400
Question 12:
What is the median of this dot plot?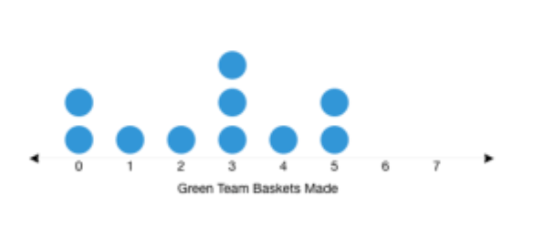
3
400
Question 11: 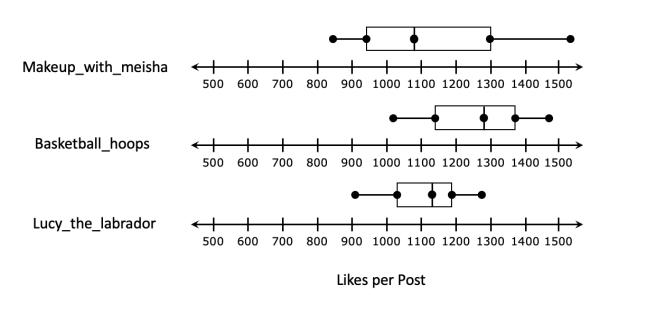 Which account is generally the most successful?
A. Makeup with Meisha because it has the largest range
B. Basketball hoops because it has the highest median
C. Lucy the labrador because it has the smallest range
D. Makeup with Meisha because it goes all the way to 150.
B.
"generally" tells us to look at median
400
The median of the set {2, 8, 4, 10, 7, 3, 1} is ___.
4
400
Should we use the mean or median?
Mean
400
Question 5:
Ms. Thompson collected data to determine the number of students absent for each month of school during the first semester. Identify the outlier in her data.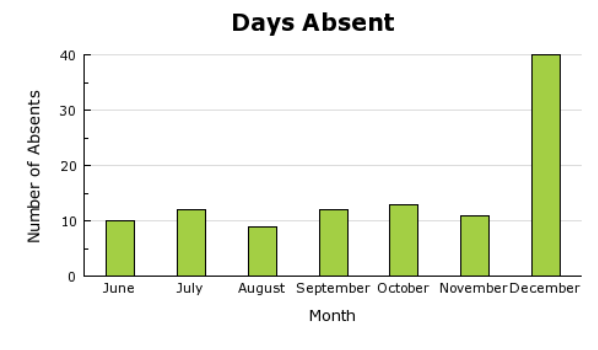
A. August
B. December
C. June
D. October
B. December
500
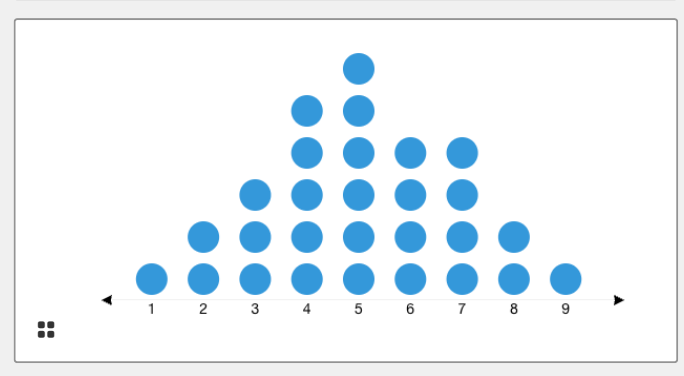
Question 15:
What is the mean of this dot plot?
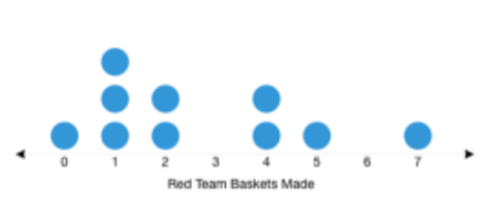
2.7
500
Question 4:
Khalil and Eduardo both enjoy building model cars. They decide to compare the number of pieces they use for each model car. The box plots below show the number of pieces they each use in their model car builds.

Which of the following statements about their data is true?
- A -- 50% of Eduardo's model cars use more pieces than 50% of Khalil's.
- B -- 50% of Eduardo's model cars use more pieces than 75% of Khalil's
- C -- 50% of Khalil's model cars use more pieces than 75% of Eduardo's
- D -- 25% of Eduardo's model cars use more pieces than 50% of Khalil's.
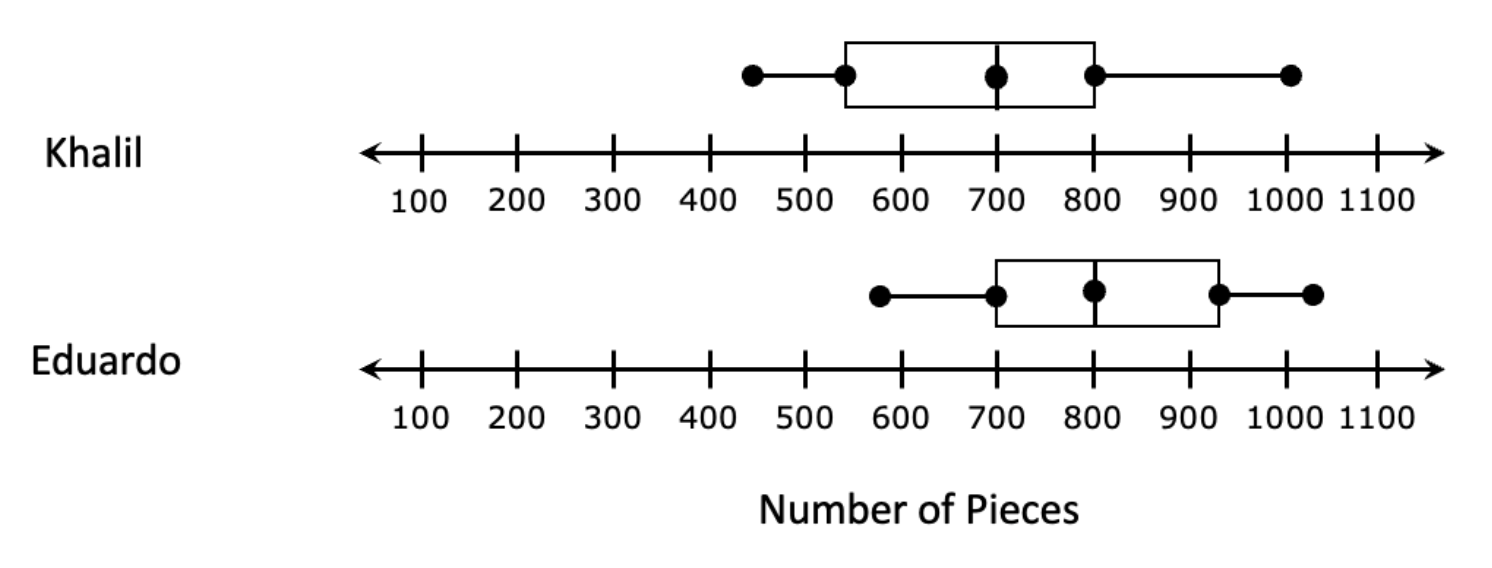 B
B
500
The range of the set {2, 8, 4, 10, 7, 3, 1} is ___.
9
500
Mrs. Smith is trying to show that her class did really well on the last test. She has four students that should have been in honors math, but instead stayed in regular math. What summary statistic should she use to defend her position?
Mean
The 4 students are outliers and would affect the mean more. She WANTS to use the center that is influenced more to show her students did well!
500
Question 13:
Find the MAD of these celebrities.
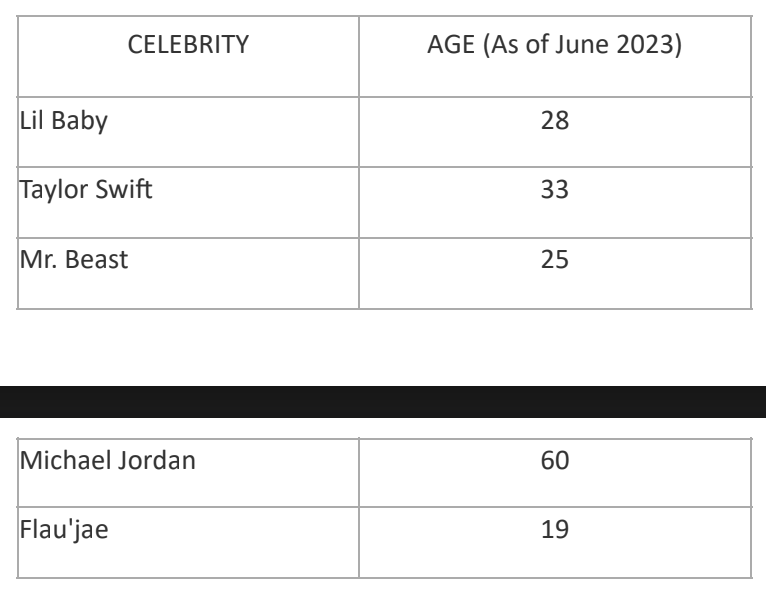
11