Box and Whisk
Quartiles
Mode/Range
IQR/SD
Mean/Median
Potpourri
100
Where can you find the max and min on a box and whisker plot?

The end of the whiskers
100
Where can you find the median on a box and whisker plot?

The line in the middle of the box.
100
How do you find the range of a set of data?
Range = Maximum - Minimum
100
What do we call a set of data's "measure of spread"?
Standard Deviation
100
Another word for the mean is the...
Average
100
Every odd number contains this letter
"e"
200
Looking at a box and whisker plot; what percentage of the data is to the right of the median (Q2)?

50%
200
Find the upper quartile (Q3) of the following data: 10, 12, 8, 13, 6, 10, 16
Q3: 13
200
Find the range of the data: 3, 6, 8, 9, 10, 12
12 - 3 = 9
200
Which group has a smaller standard deviation:
Group A: 9,3,7,4,1,6,4,1,9,15,6
OR
Group B: 7,6,7,6,7,6,7,6,7,6
Group B
200
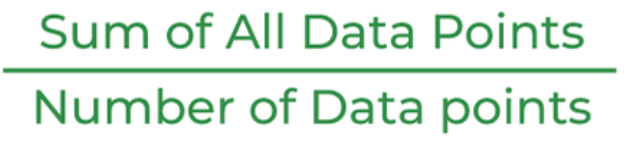
How do you find the mean?
200
"One" is the only integer spelled in reverse alphabetical order. What is the only integer that is spelled in alphabetical order?
Forty
300
Looking at a box and whisker plot; the length of one whisker makes what percentage of the data?

25%
300
Where can you find the lower quartile on a box and whisker plot?
The line on the left edge of the box; the start of the box
300
What is mode?
The number that appears the most in a data set.
Food for thought:
Can you have no mode?
Can you have more than one mode?
300
How do you find the IQR of a set of data?
IQR = Q3 - Q1
300
Find the mean of the following data: 20, 16, 11, 10, 16, 10, 8, 7. Round to the nearest tenth.
Mean = 12.3
300
Tetraphobia is the fear of this number
4

400
Looking at a box and whisker plot; what percent of the data is to the left of Q3?

75%
400
Find the lower (Q1) & upper quartile (Q3) of the data: 4, 5, 2, 10, 3, 9, 5, 3, 8, 5, 6
Q1: 3 Q2: 5 Q3: 8
400
What is the mode of the data set? 3, 5, 12, 6, 21, 19, 14, 8, 19, 6
6, 19
400
IQR measures the length of what in a box and whisker plot?
The box
400
What must you do to find the median?
Order the data points from least to greatest, then find the middle value
400
As of 2019, this is the most popular favorite number
7
500
Looking at a box and whisker plot; what percent of the data is in the box?

50%
500
Find Q1, Q2 and Q3 of the following data: 10, 17, 8, 13, 6, 10, 16, 19
Q1: 8 Q2: 11.5 Q3: 17
500
Find the mode AND range of the following data: 10, 12, 8, 13, 6, -2, 16
Range: 16 - (-2) = 18
Mode: No mode
500
Find the IQR of the following data: 10, 12, 8, 13, 6, 10, 16
13 - 8 = 5
500
Find the median of the set of data: 10, 5, 9, 8, 3, 2
6.5
500
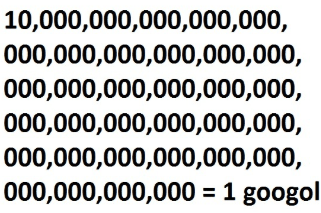
The number 1 followed by 100 zeros is called this
A googol