What do we call the data point that occurs the most frequently?
Mode
What is represented by the center line in a box and whisker plot?
Median
Which can be found the easiest by looking at a dot plot?
A. Mean
B. Mode
C. Median
B. Mode
True or False, A Histograms shows every data point.

False
Find the mean; 5, 7, 9, 10, 2, 1, 1
What is 5
What do we call the data point that is in the center of our data when listed least to greatest?
Median
Find the Range and IQR
R= 8
IQR= 5
How many students were asked how many hours they worked on homework for the week?

25
A data point that does not fit in with the majority of the data.
Outlier
Random Trivia: Why was 6 afraid of 7?
Because 7 ate 9...
7 -8- 9
Find the Mode; 4, 9, 3, 2, 9, 6, 10, 2, 11
What is 9 and 2
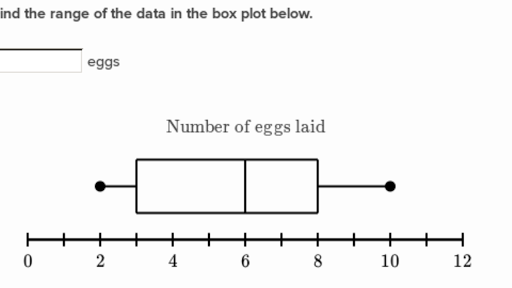
What is the median number of eggs laid?
6
What is the median?

3
Random Trivia: How are a dollar and a moon alike?
They both have quarters.
What is the mode? 34, 3, 6, 45, 23, 16, 10, 31.
None
What is the Median 6, 11, 3, 7, 5, 13, 1, 3
what is 5.5
What percentage laid more than 8 eggs?
25%
What is the range?
9-0 = 9
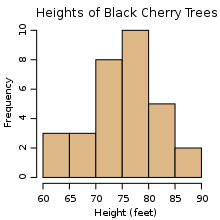
What interval represents the most frequent heights of trees?

75-80 feet
What is the range? 34, 3, 6, 45, 23, 16, 10, 31.
42
Random trivia: Which Principal owned a donut shop?
Dr. Kotch
How many laid at least 3 eggs?
75%
What is the mode and how do you know? What information does that tell us about our data?

1 because it has the most data points. This tells us that most students spent 1 hour on homework per week.
How many trees were included in this survey?

31
Find the median. 34, 3, 6, 45, 23, 16, 10, 31.
19.5
