Miscellaneous
Measures of Center
Measures of Spread
Standard Deviation
Box Plots
100
The median of the first or "lower" half of the data is called?
Q1 (Lower Quartile)
100
Find the mean:
122, 139, 189
150
100
Find the range for this data set.
13, 14, 18, 13, 12, 17, 15, 12
Range = 6
100
What the average of the squared values?
Variance
100
What is the median of the boxplot below?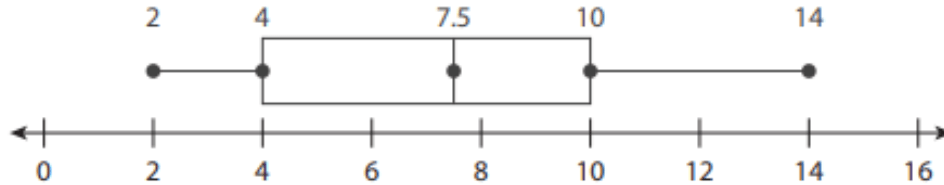
7.5
200
Type of distribution for the following data
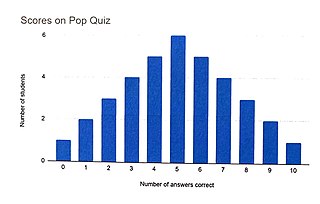
Symmetrically Distributed
200
Find the mean and median:
47, 47, 48, 49, 50, 54, 55
Mean: 50
Median: 49
200
Find the IQR:
36, 18, 12, 10, 9
17.5
200
List out the 5 steps needed to solve for standard deviation.
1) Find the mean
2) Find the difference of each value and the mean (data value - mean)
3) Find the squared difference
4) Find the variance (average of squared values)
5) Take the square root of the variance.
200
What are the range and IQR shown on this box plot?
Range: 12
IQR: 6
300
Type of distribution for the following data. What is the best measure of center and spread to use?
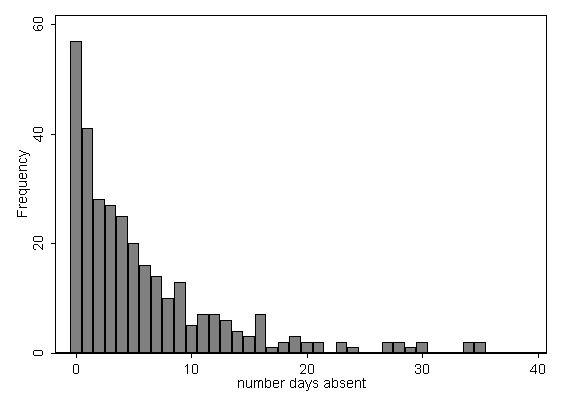
Positively Skewed; Median and IQR
300
Find the mean and median:
84, 94, 93, 89, 94, 81, 90
Mean: 89.3
Median: 90
300
Find the range and IQR:
28, 30, 29, 26, 31, 30
Range: 5
IQR: 2
300
Find the mean, difference of values, squared values, variance, and standard deviation:
On your board, write only the standard deviation
36, 18, 12, 10, 9
standard deviation: 11.180
300
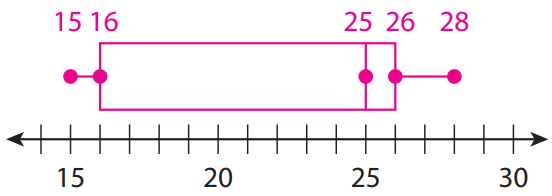
Create a box plot with the following data:
15, 16, 25, 26, 28
400
Data Set F has a mode of 3 and a range of 5. If every element in Data Set F is multiplied by 7, what will the new mode and range be?
mode: 21
range: 35
400
Find the mean, median, and mode:
28, 30, 29, 26, 31, 30
Mean: 29
Median: 29.5
Mode: 30
400
Find the Q1 and Q3
13, 14, 18, 13, 12, 17, 15, 12
Q1: 12.5
Q3: 16
400
Find the mean, difference of values, squared values, variance, and standard deviation:
On your board, write only the standard deviation
3, 7, 4, 6, 5
standard deviation: 1.414
400
90 is ___________ for Edmonton and ___________ for Calgary

maximum; Q3
500
Data Set F has a mean of 7 and a standard deviation of 5. If every element in Data Set F is added by 2, what will the new mean and standard deviation be?
mean: 9
standard deviation: 5
500
Which data set has a higher mean?
First set: 13, 14, 18, 13, 12, 17, 15, 12 OR
Second set: 13, 12, 10, 16, 19
First set (14.25)
500
Find the Q1, Q3, and IQR:
125, 136, 150, 119, 150, 143
Q1: 125
Q3: 150
IQR: 25
500
Calculate the mean, difference from mean, squared values, variance, and standard deviation (Round to the nearest thousandth)
22, 25, 32, 20, 22, 29
mean: 25
difference of values: -3, 0, 7, -5, -3, 4
squared values: 9, 0, 49, 25, 9, 16
variance: 18
standard deviation: 4.243
500
What percent of the data lies below 44?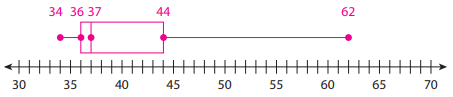
75%