Sampling
Types of Data & Data Collection
Central Tendency
Five Number Summary
Standard Deviation
100
A researcher wants to understand the dietary habits of college students. They randomly select 50 students from a list of all students at a university.
Simple Random Sampling
100
Data that has a meaningful order but no consistent difference between values (e.g., satisfaction ratings).
Ordinal Data
Answer: C (Data that has a meaningful order but no consistent difference between values)
100
Calculate the mean of the following dataset:
4, 8, 6, 5, 3, 7
5.5
100
What are the values we look for when finding a five number summary?
Minimum, Q1, Median, Q3, Maximum
100
What is the formula used to find standard deviation ?
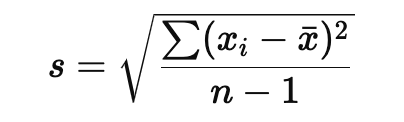
200
A factory wants to inspect the quality of its products. Every 10th item produced on the assembly line is selected for quality control checks.
Systematic Sampling
200
A school district is interested in understanding students' performance across various subjects. They analyze test scores from the entire district. What data collection method is this?
Analyzing existing data (Secondary data analysis).
200
How is this data distributed?
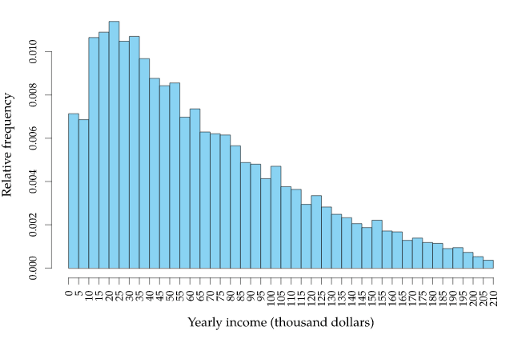
Right-skewed
200
The value below which 25% of the data falls
First Quartile (Q1)
200
A sample of five students’ heights (in centimeters) is as follows:
150, 155, 160, 165, 170
Using the range rule of thumb, estimate the sample standard deviation.
5
300
A researcher wants to study the job satisfaction of employees in a large corporation. The corporation has employees in three different departments: Sales, Marketing, and Research. The researcher divides the employees into these three departments and randomly selects 20 employees from each department to participate in the survey. What sampling method is this?
Stratified Sampling
300
For each of the following examples, identify whether the data is Qualitative or Quantitative, and further classify it as Nominal, Ordinal, Discrete, or Continuous.
a) Number of students in a class
b) Brand of cereal
c) Rating of a movie on a scale from 1 to 5
d) Height of students in centimeters
a) Number of students in a class
Answer: Quantitative, Discrete
b) Brand of cereal
Answer: Qualitative, Nominal
c) Rating of a movie on a scale from 1 to 5
Answer: Quantitative, Ordinal
d) Height of students in centimeters
Answer: Quantitative, Continuous
300
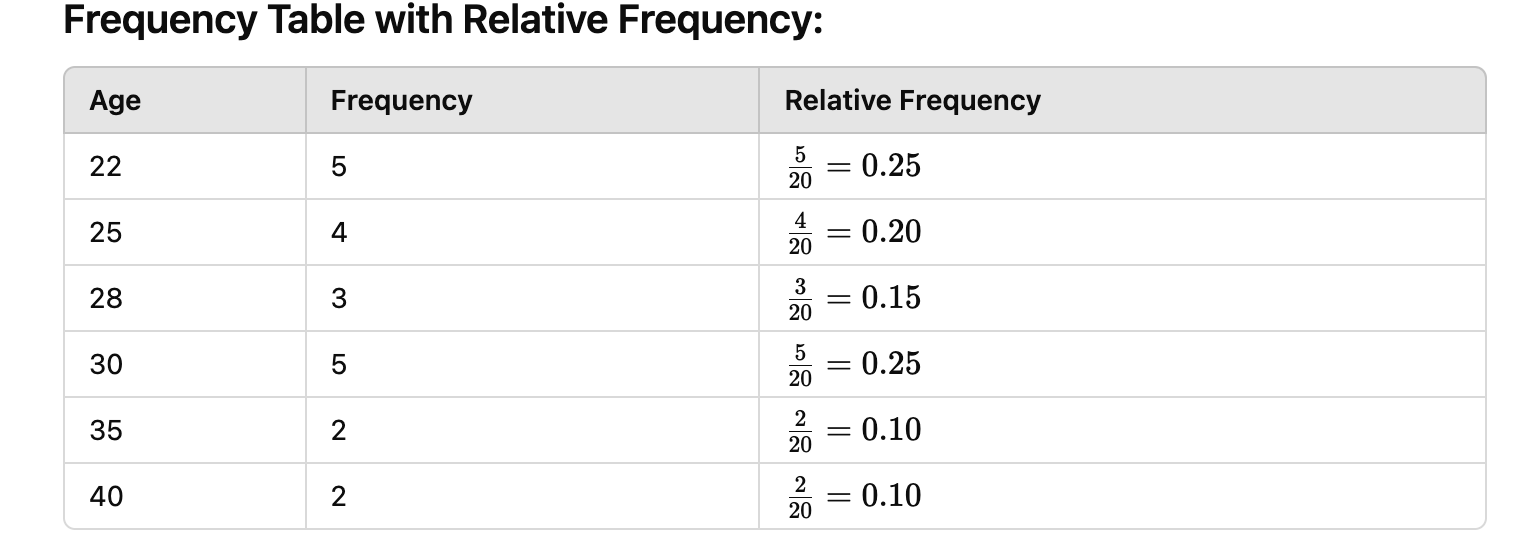
Dataset: The following are the ages of 20 participants in a survey:
Ages: 22, 25, 22, 30, 25, 28, 30, 22, 35, 28, 30, 40, 25, 22, 35, 28, 30, 22, 25, 40
Question:
Create a frequency table that includes:
- Age
- Frequency
- Relative Frequency (to two decimal places)
300
Dataset: The following are the ages (in years) of a group of 10 participants in a study:
Ages: 22, 25, 29, 30, 35, 36, 40, 42, 45, 50
Find the five number summary.
- Minimum: 22
- Q1: 29
- Median (Q2): 35.5
- Q3: 42
- Maximum: 50
300
Ages: 20, 22, 25, 27, 30
- Calculate the sample standard deviation
3.81
400
A researcher wants to study the health outcomes of residents in a city. The city is divided into 10 neighborhoods. If the researcher randomly selects 3 neighborhoods and surveys every resident in those neighborhoods, what type of sampling method is being used?
Cluster
400
What is the difference between an independent variable and a dependent variable ?
The independent variable is the variable that is manipulated or changed by the researcher to observe its effects. Example: In a study examining the effect of different amounts of sunlight on plant growth, the amount of sunlight (e.g., 2 hours, 4 hours, 6 hours) is the independent variable.
The dependent variable is the variable that is measured or observed in response to changes in the independent variable.Example: Continuing with the plant growth study, the height of the plants after a certain period would be the dependent variable, as it depends on the amount of sunlight received.
400
Find the mean, median, mode, and outliers:
Dataset: 20, 22, 22, 23, 23, 25, 26, 30, 100
Mean: 32.33
Median: 23
Mode: 22 and 23
Outlier: 100
400
A student scored 78 on a math exam, and the scores of all students who took the exam are as follows:
Scores: 65, 70, 75, 78, 80, 85, 88, 90, 92, 95
Question:
- Calculate the percentile rank of the student’s score (78).
- Percentile Rank: 30
This means the student’s score of 78 is at the 30th percentile, indicating that 30% of the students scored below that score.
400
Dataset: 70, 75, 80, 85, 90
Calculate the sample standard deviation
7.91
500
A health organization conducts a survey on the exercise habits of adults in a city. They ask 200 adults about their weekly exercise routines and calculate the average minutes spent exercising.
- Population:
- Sample:
- Sample Statistics:
- Population Parameters:
- Population: All adults in the city
- Sample: The 200 adults surveyed
- Sample Statistics: Average minutes spent exercising (the calculated mean)
- Population Parameters: The true average exercise time for all adults in the city (not directly provided but is what the sample estimates)
500
A study examines whether studying with music affects student test scores. One group studies with music, while the other studies in silence. Both groups take the same test afterward.
- Independent Variable:
- Dependent Variable:
- Control Variable:
- Experimental Group:
- Control Group:
Question 2: Identifying Variables
- Independent Variable: The presence of music (studying with music vs. studying in silence)
- Dependent Variable: Student test scores
- Control Variable: Test conditions (time of day, type of test, study materials, etc.)
- Experimental Group: The group studying with music
- Control Group: The group studying in silence
500
A student takes three exams with the following scores and weightings:
Midterm (40%): 88
Final (50%): 92
Project (10%): 85
Weighted Mean Score: 89.7
500
Dataset: The following are the test scores of 15 students in a statistics class:
Scores: 65, 70, 75, 80, 82, 85, 85, 90, 92, 94, 95, 98, 100, 100, 100
Question:
Calculate the five-number summary for the dataset and use it to draw a box-and-whisker plot. Include the following in your answer:
- Minimum
- First Quartile (Q1)
- Median (Q2)
- Third Quartile (Q3)
- Maximum
Label your box-and-whisker plot clearly.
- Minimum: 65
- Q1: 80
- Median (Q2): 90
- Q3: 95
- Maximum: 100
BOX AND WHISKER PLOT
500
Datasets: Consider the following two sets of scores from two different classes on a math test:
Class A Scores: 78, 82, 85, 90, 92
Class B Scores: 70, 75, 80, 85, 95, 100
Calculate the sample standard deviation for both Class A and Class B.
Compare the two standard deviations. Which class shows more variability in scores?
A: 5.73
B: 11.58
Class B shows more variability in scores, as indicated by its higher standard deviation (11.58 compared to 5.73 for Class A). The greater standard deviation in Class B suggests that the test scores are more spread out from the mean, indicating a wider range of performance levels among the students compared to Class A, where the scores are closer to each other.